Fig. 3.
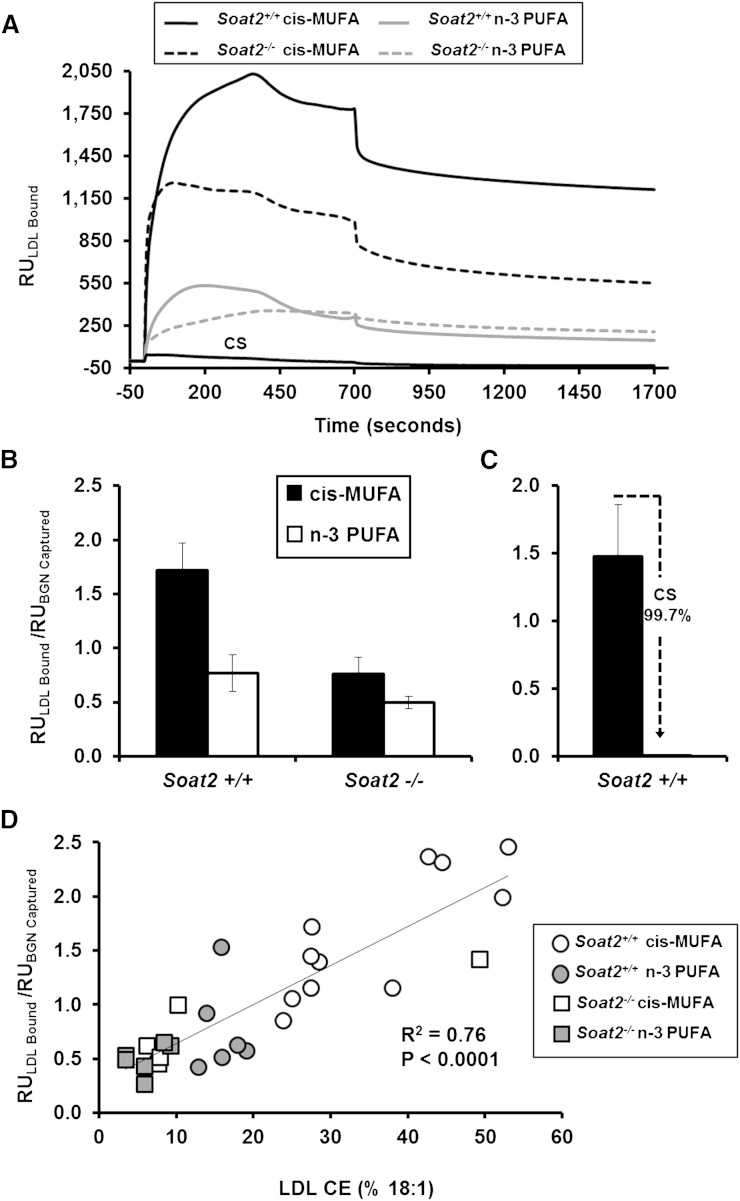
Interaction of LDL isolated from plasma of individual apoB-100-only Ldlr−/− mice with immobilized biglycan as assessed by SPR. Binding was determined using 30 μg/ml of LDLc isolated from plasma of individual mice. A: Representative kinetic plots of LDL binding for a representative mouse LDL sample from each experimental group. CS shows chondroitin sulfate inhibition of LDL binding where LDL from a Soat2+/+ mouse consuming the cis-MUFA diet was studied. B: Peak binding responses of LDL particles. The bars represent the means (± SEM) for 6–12 mice for each diet/genotype group; for all groups of mice, diet was fed for 12 weeks at the time of blood sampling. By two-way ANOVA, the diet effect was significant (P = 0.0006), and the responses for Soat2+/+ versus Soat2 −/− groups were significantly different (P = 0.005), but there was no significant interaction. C: Binding of LDL particles isolated from Soat2+/+ mice consuming the cis-MUFA diet incubated with or without 25 μg/ml of CS GAGs. D: Regression analysis comparing LDL binding to immobilized BGN with the percentage of CO in the CE of the different LDL particles. The line is the least-squares best-fit regression line, and the regression coefficient was highly significant.

