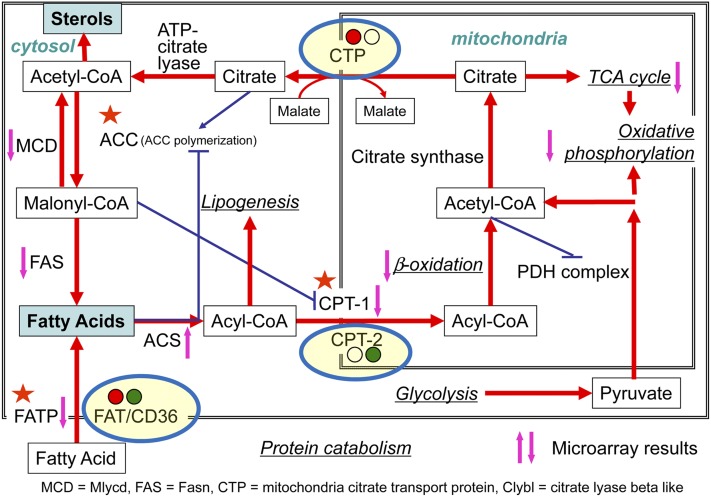
Fig. 6.
Changes in the genes and processes related to mitochondrial metabolism in RAW264.7 and TGEM cells treated with KLA. The up or down arrows indicate whether the gene (or most of the genes in the case of a pathway) is upregulated or downregulated commonly in both cells. For the genes showing different/unique regulation in the two cell types, the gene is enclosed in an ellipsoid and upregulation (red) or downregulation (green) is indicated in two circles (left circle, RAW264.7 cells; right circle, TGEM cells). Based on a diagram by Yihua Zhao.

