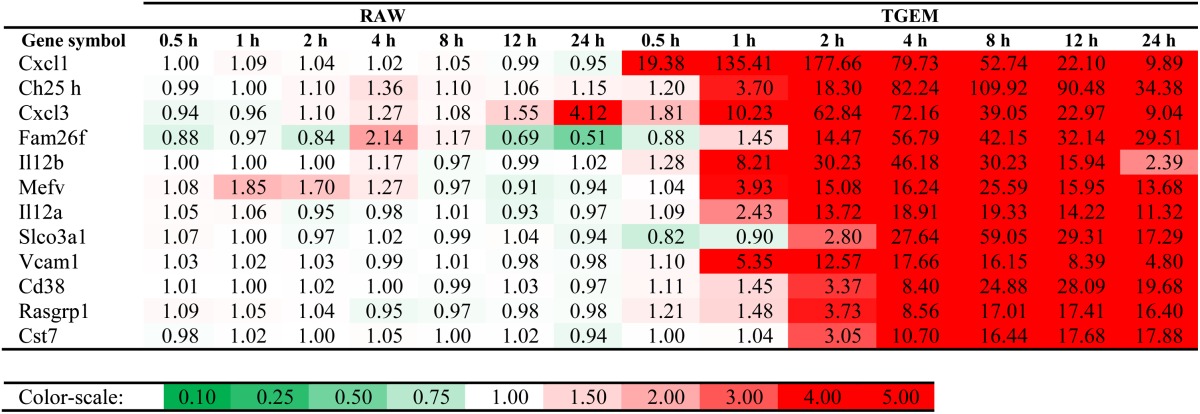
TABLE 3.
Genes highly upregulated in TGEM cells, but not in RAW264.7 cells upon KLA treatment
Top 12 genes in decreasing order of geometric mean of fold-change time course for TGEM cells and minimum (Pearson correlation, distance-based correlation) ≤ −0.50 are listed. Color-scale: 0.1, dark green; 1, white; 4, dark red (linear).

