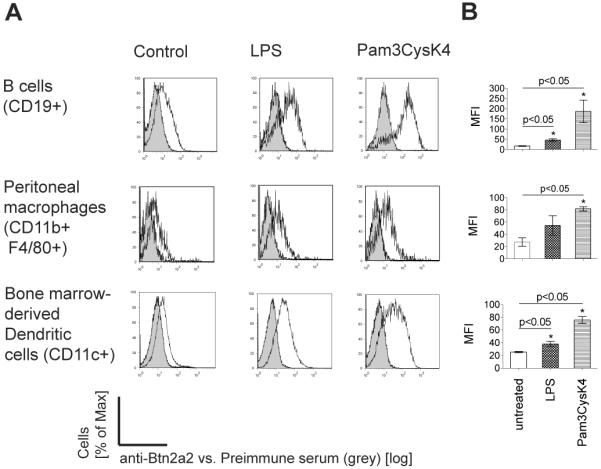
Figure 1. Increased cell surface expression of Btn2a2 on APC after activation.

APC: Splenic B cells; bone marrow DC (20 ng/ml GM-CSF, 10 ng/ml IL-4); peritoneal macrophages enriched by adhesion to plastic. Activation was for 16 h with 100 ng/ml LPS or 1 μg/ml Pam3CysK4. (A) Anti-Btn2a2 antibody (black outline), pre-immune serum (grey filled). (A) Data representative of 3 experiments. (B) Significance (p < 0.05) confirmed with paired t-test (*).
