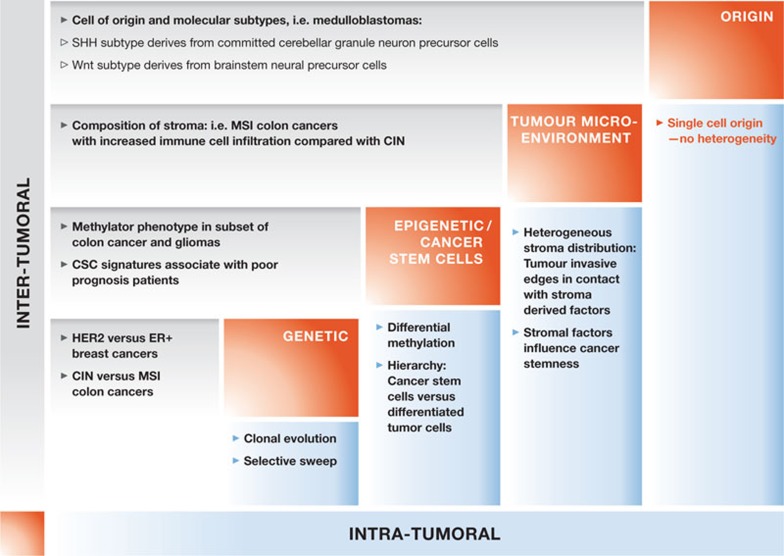
Figure 1.
Schematic representation of the various factors (diagonal, red boxes) that affect intra- (x-axis, light blue) and inter- (y-axis, light grey) tumour heterogeneity. Several examples are depicted for each factor and for both forms of tumour heterogeneity. CIN, chromosomal instability; CSC, cancer stem cell; MSI, microsatellite instability; SHH, sonic hedgehog signalling.

