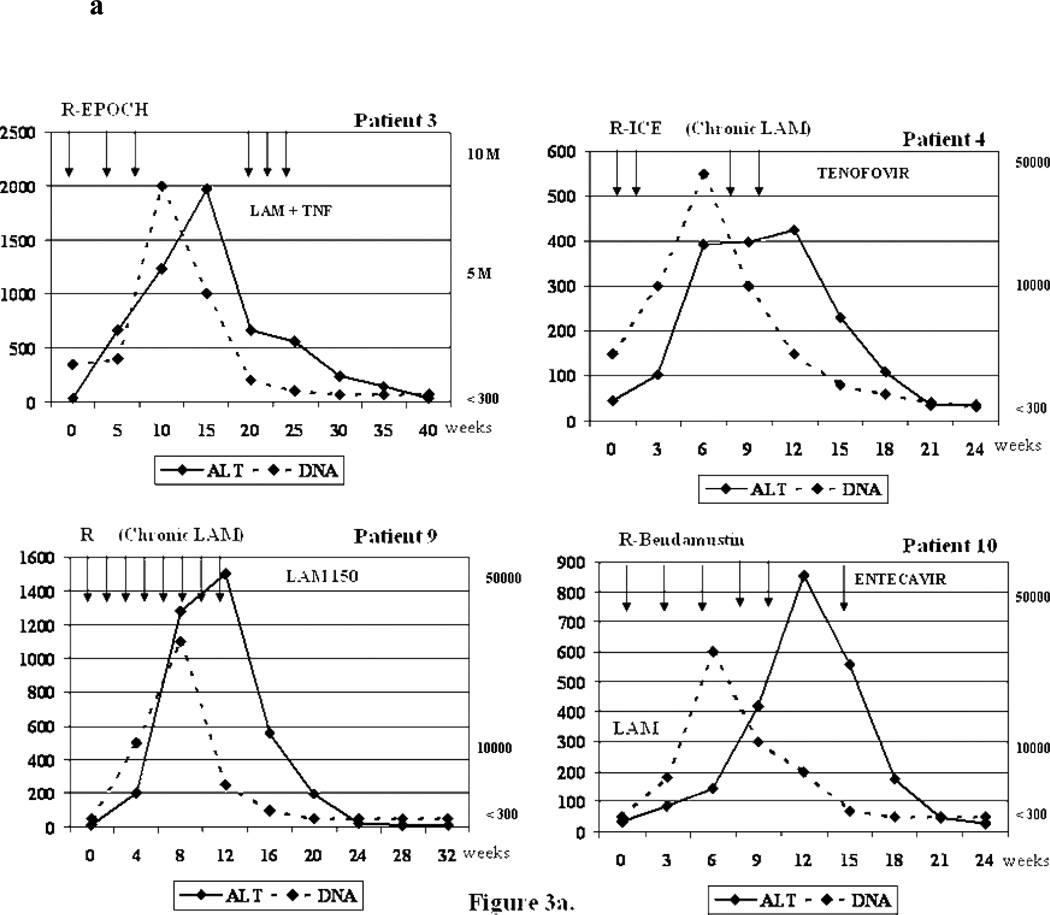
Figure 3.
a. Biochemical and virologic outcome of four representative reactivation cases.
R-ICE= Rituximab+ ifosfamide, carboplatin, etoposide; R-EPOCH=Rituximab + etoposide, prednisone, vincristine, cyclophosphamide, hydroxydaunorubicin; R-CHOP=Rituximab + cyclophosphamide, doxorubicin, vincristine and prednisone/prednisolone ; ALT= alanine aminotransferase; LAM= Lamivudine; TNF=Tenofovir; DNA= Viral Load (HBV DNA). Arrows = Indicate the time when the cycle of chemotherapy was administrated.
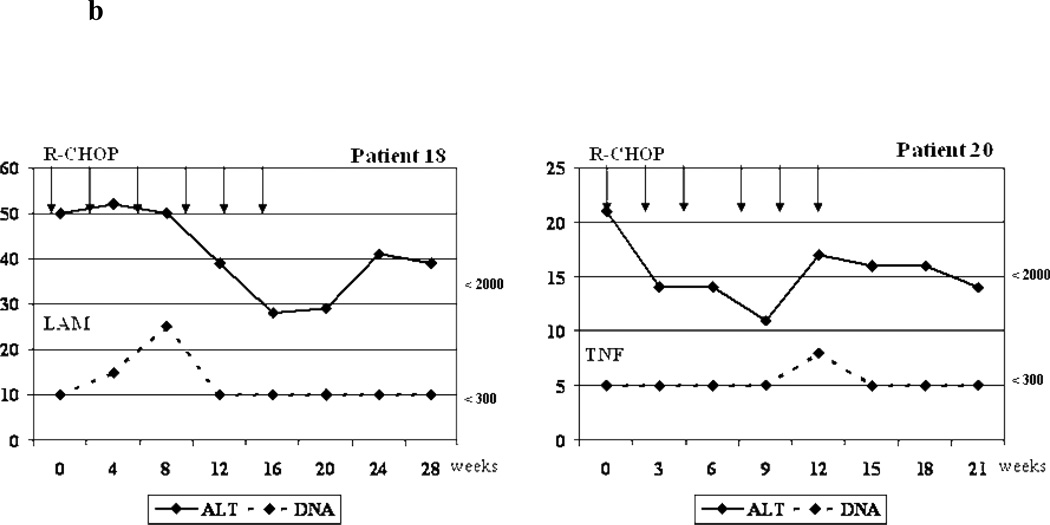
b. Biochemical and virologic outcome of two cases without reactivation that received antiviral prophylaxis.
R-CHOP =Rituximab + cyclophosphamide, doxorubicin, vincristine and prednisone/prednisolone ; ALT= alanine aminotransferase; LAM= Lamivudine; TNF=Tenofovir; DNA= Viral Load (HBV DNA). Arrows = Indicate the time when the cycle of chemotherapy was administrated.


