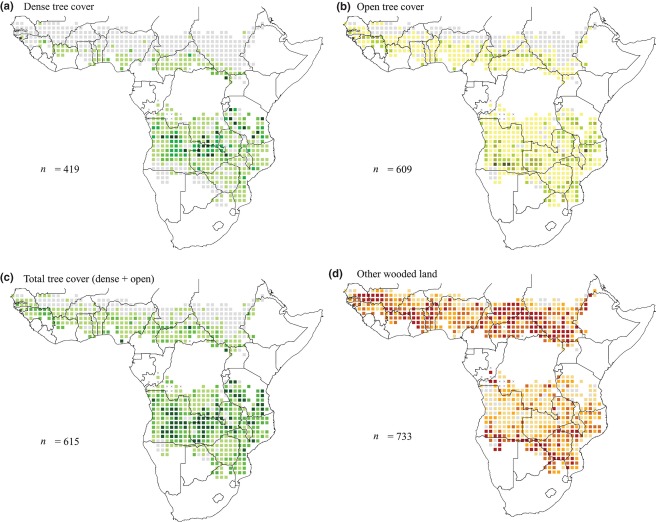
Figure 2.
Maps of Africa showing the areal proportions of tree cover and other wooded land cover for the year 2000 in African dry forests and woodlands. At each sample site, land cover was identified from analysis of 20 km × 20 km Landsat image subsets. (a) Dense tree cover; (b) open tree cover; (c) total tree cover (dense and open); (d) other wooded land. Four categories from pale to dark represent areal proportions of [0.001, 0.25], (0.25, 0.5], (0.5, 0.75] and (0.75, 1], respectively; the remaining sites with a land-cover proportion < 0.001 are in light grey. Crosses correspond to missing data; n = total number of sample sites where the land cover has been identified.

