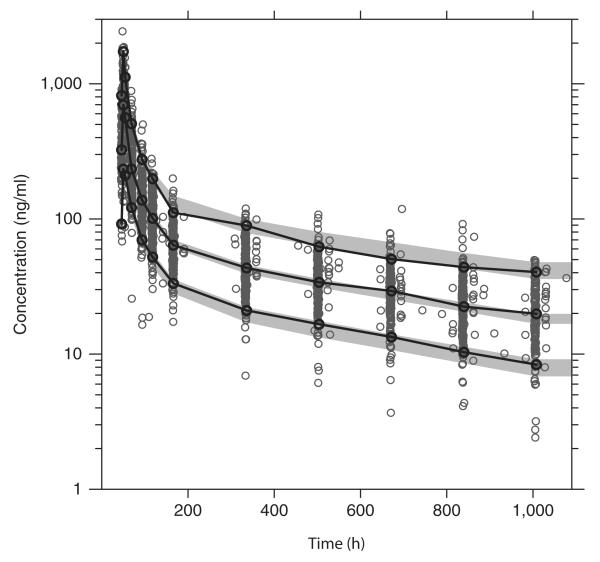
Figure 3.
Prediction-corrected visual predictive check of the final model describing the population pharmacokinetics of piperaquine in children with uncomplicated falciparum malaria in Burkina Faso. Open circles: observed data points; solid lines: 5th, 50th, and 95th percentiles of the observed data; shaded area, 95% confidence interval of simulated (n = 2,000) 5th, 50th, and 95th percentiles. Capillary plasma piperaquine concentrations were transformed into their logarithms (base 10).

