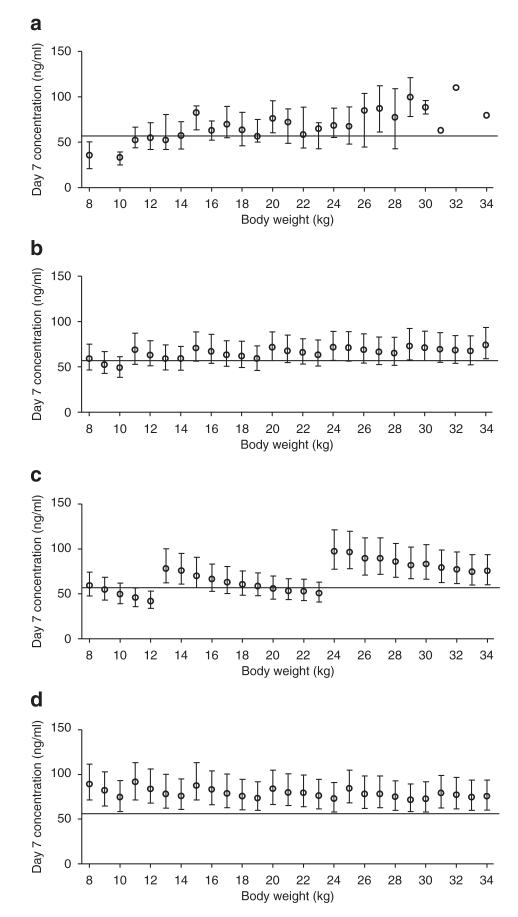
Figure 4.
Observed and simulated day 7 capillary piperaquine concentrations stratified for body weight (1,000 simulated patients at each body weight) after different dose regimens. Black circles: median values ± interquartile range; black solid horizontal line: cutoff value for therapeutic failure (57 ng/ml for capillary concentrations). (a) Observed day 7 capillary concentrations; (b) predicted day 7 capillary concentrations after the dose regimen used in this study; (c) predicted day 7 capillary concentrations after the dose regimen proposed by Sigma-tau; (d) predicted day 7 capillary concentrations after an increased dose regimen to achieve >75% of concentrations above the defined cutoff at each body weight (Table 3).

