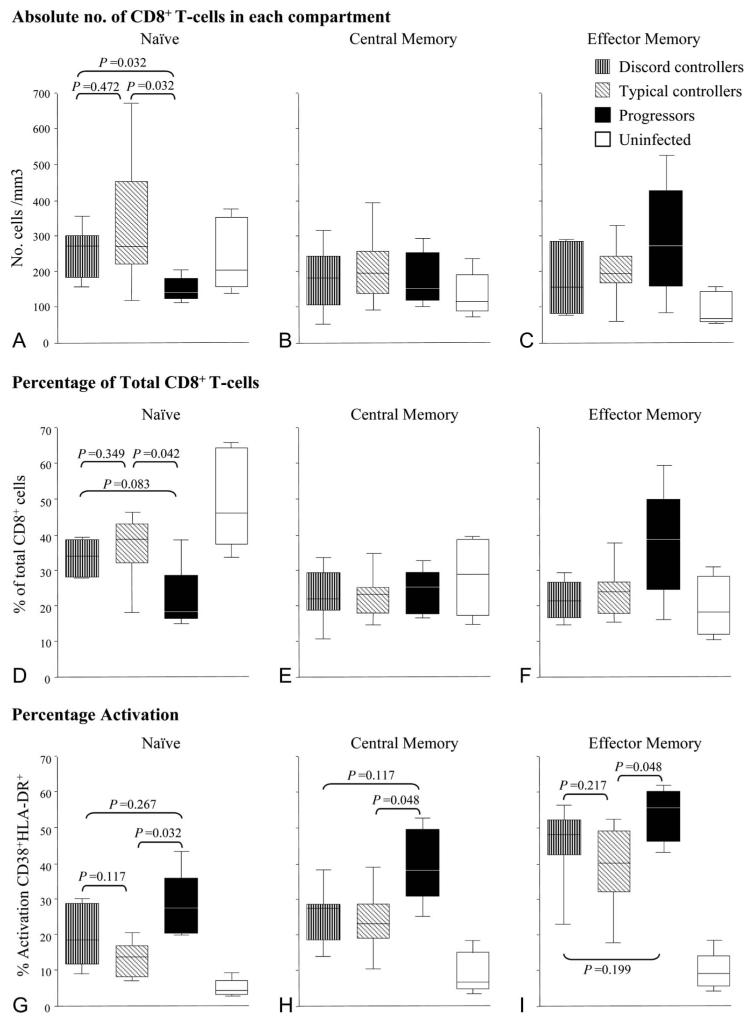
FIGURE 3.
Representation of CD8+ T-cell subsets by patient group. Patients analyzed as described in Figure 2: discord controllers, typical controllers, progressors, and uninfected subjects. Absolute numbers of cells in CD8+ T-cell subsets are shown in (A) naive (CD45RA+CD62L+), (B) central memory (CD45RO+CD62L+), and (C) effector memory (CD45RO+CD62L−). Percentage of cells in CD8+ T-cell subsets compared with total CD8+ T-cell pool are shown for (D) naive, (E) central memory, and (F) effector memory. Percentage activation of cells in CD8+ T-cell subsets (as percentage of total cells in that subset) by patient group is shown in (G–I). Each central bar represents the median value, each box represents the IQR, and the whiskers represent the minimum and maximum values. Statistical analysis employed a Mann–Whitney U test.

