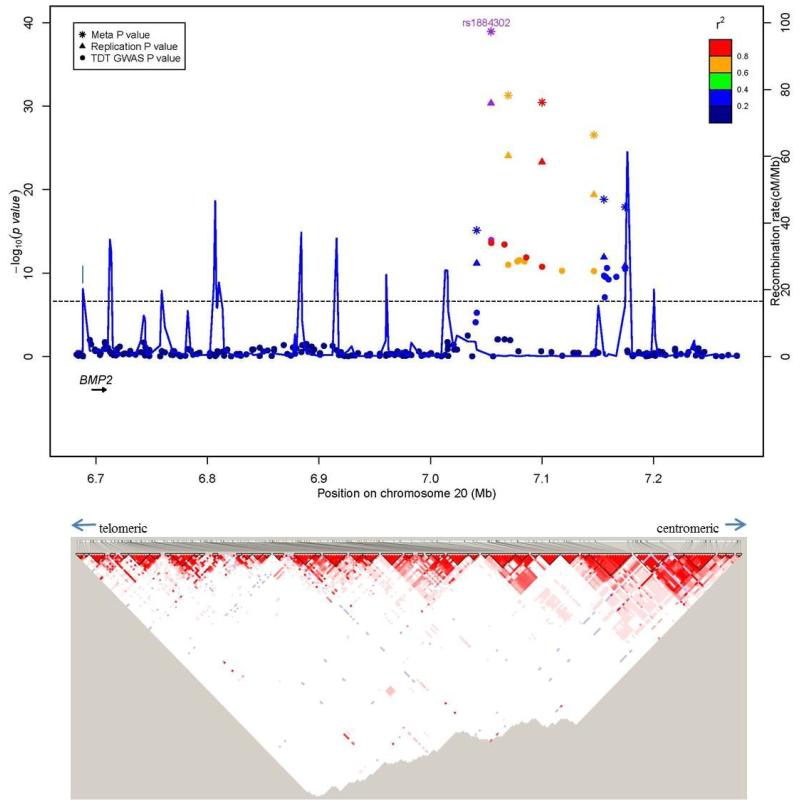
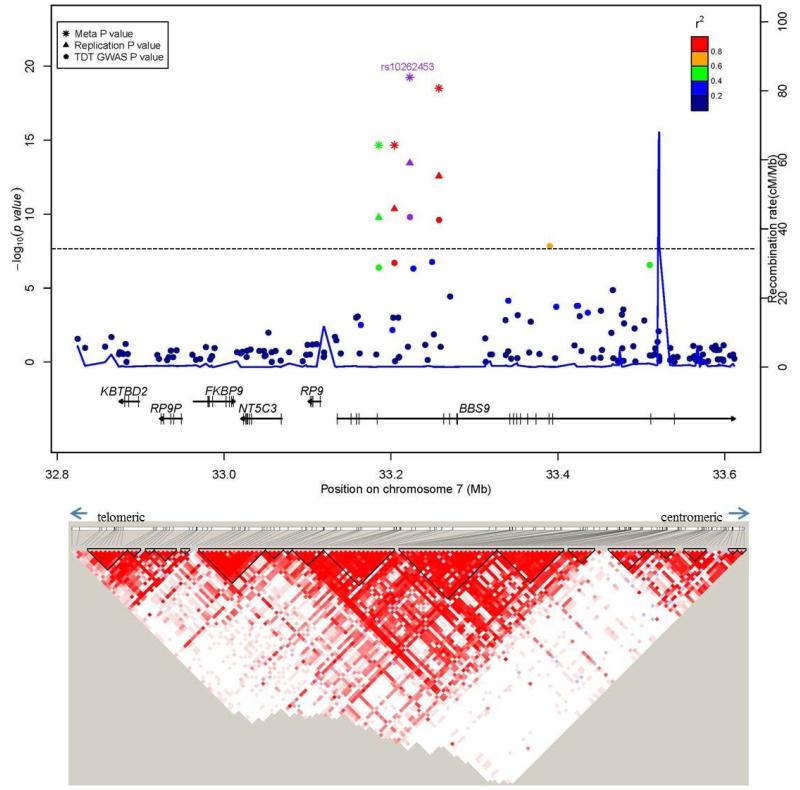
Figure 2. Regional association plots for associations with sNSC at genome-wide significance.
Upper panel: P-values (-log10) of the GWAS (solid circle), replication (triangle) and meta-analysis (asterisk) on the y-axis are plotted against the genomic positions of each SNP on the x-axis on (a) chromosome 20 and on (b) chromosome 7. Horizontal dashed line corresponds to the genome-wide significance threshold of P ≤ 5 × 10⁻⁸. Genes in region are depicted below (not to scale). The LD (r2) between the lead SNP and other SNPs are indicated in different colors. The blue lines indicate the recombination rates in cM per Mb using HapMap controls. Lower panel: LD plots (based on r2 value) using genotyped subjects from the GWAS study.


