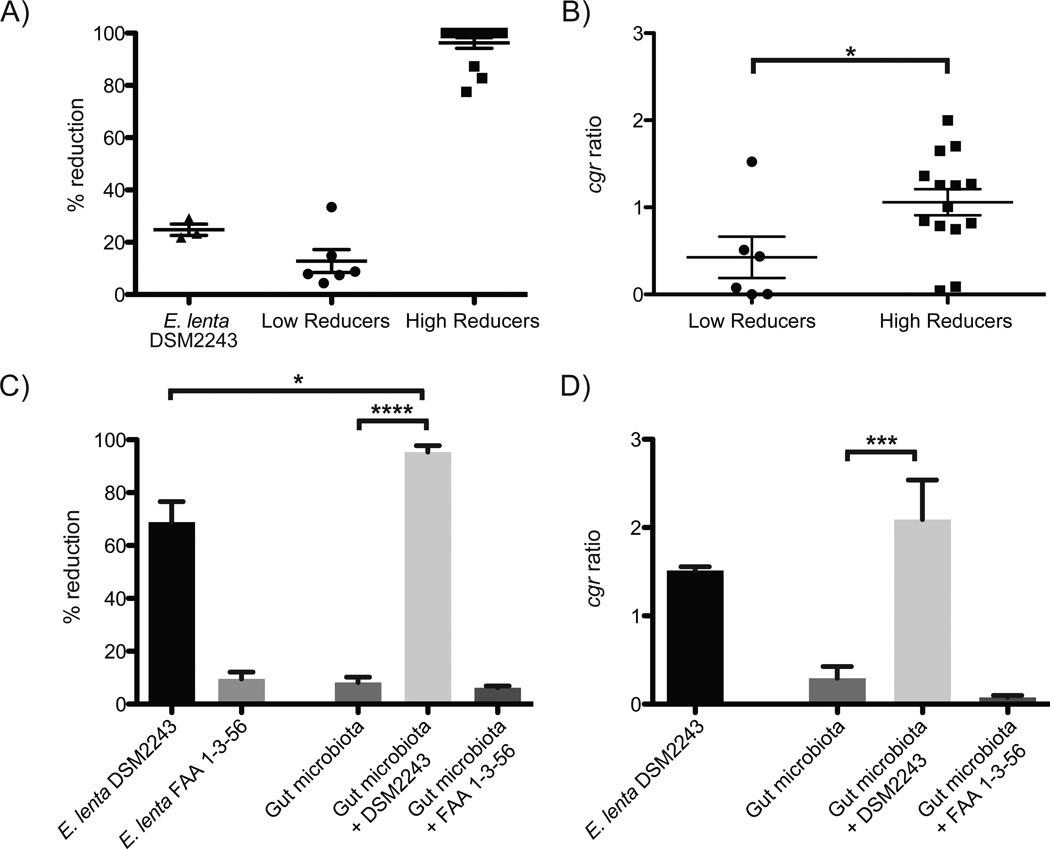
Fig. 2. A microbial biomarker predicts the inactivation of digoxin.
(A) Liquid chromatography/mass spectrometry (LC/MS) was used to quantify digoxin reduction in the fecal microbiomes of 20 unrelated individuals. (B) The cgr ratio was significantly different between low and high reducers. Data represent qPCR using the cgr2 gene, and E. lenta specific 16S rDNA primers (table S4). (C) Five low reducing fecal microbial communities were incubated for five days in the presence or absence of E. lenta DSM2243 or FAA 1-3-56. LC/MS was used to quantify the completion of digoxin reduction. Supplementation with the non-reducing strain of E. lenta did not significantly affect digoxin reduction efficiency. (D) The cgr ratio was obtained for each of the low reducing microbial communities post incubation. Outliers were identified using Grubbs’ test (P<0.01) and removed. Values are the mean±sem. Points in A,B represent biological replicates. Asterisks indicate statistical significance by Student’s t test (*=P<0.05; ***=P<0.001; ****=P<0.0001).

