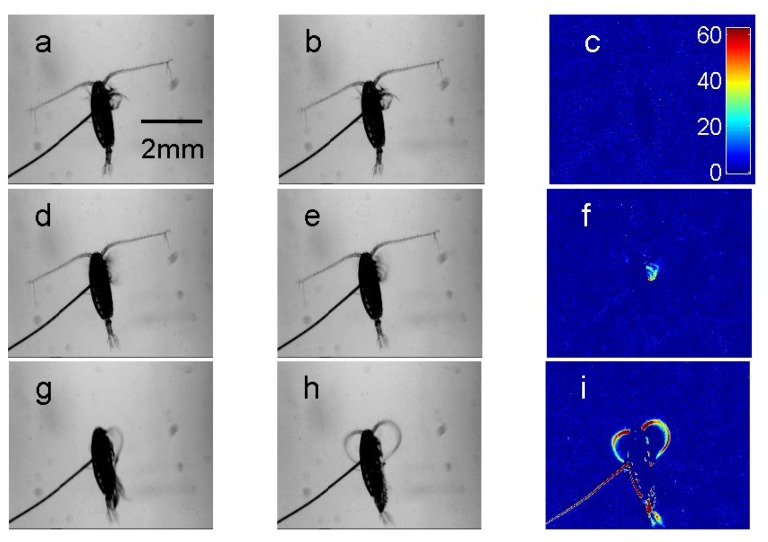
Figure 1.
Consecutive frames from video recordings of behavioral states of a tethered copepod with associated color-coded maps for changes in pixel intensity. Image a and b show two consecutive frames during copepod breaking resulting in minimal pixel change c. Images d and e show two consecutive images recorded during slow swimming. The pixel color intensity around the swimming appendages can be observed in image f. Images g and h show two consecutive images during grooming, this behavior resulted in large changes in pixel intensity. The color scale is identical across c, f and i.

