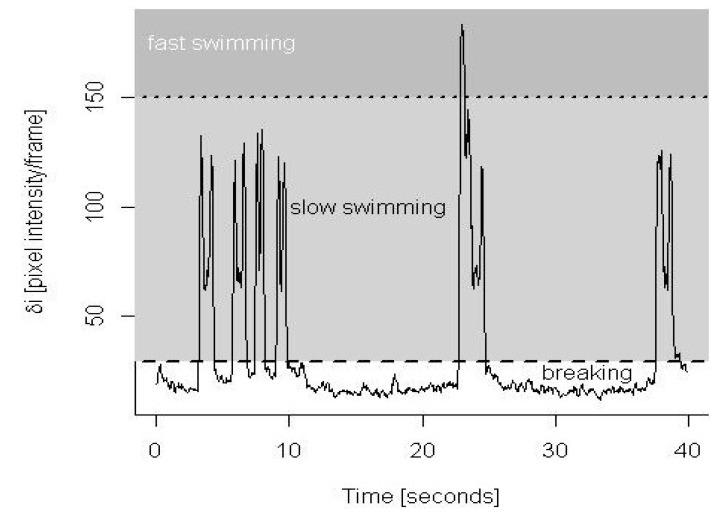
Figure 2.
Semi-automated method for classifying copepod behaviors. From video recordings of tethered copepods we extracted maximal changes in pixel intensity (δi) over time. For each individual copepod, threshold values were assigned to identify periods of breaking (no shading), slow swimming (light grey shading) and fast swimming/grooming events (dark grey shading). The spikes in δi at the start and end of slow swimming bouts were due to the movement of the tether (a flexible hair) at the onset and end of copepod movement. In between these spikes, δi took lower values resulting from the copepod’s moving appendages (see Figure 1f). A video showing the slow swimming bouts and grooming behavior associated with this 40 s sequence is available as supplementary material online.

