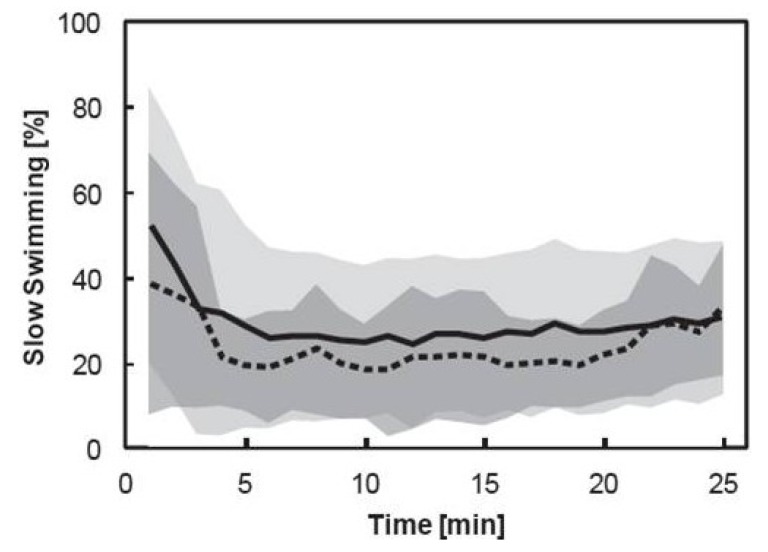
Figure 3.
The proportion of the pooled time budget copepods allocated towards slow swimming in high (dashed line) and low (solid line) dimethyl sulfide (DMS) treatments. Values represent the mean of 12 copepods each minute for 25 min of analysis. Standard deviation of the mean is shown as the dark grey shaded area for the high DMS treatment and light grey shaded area for the low DMS treatment.

