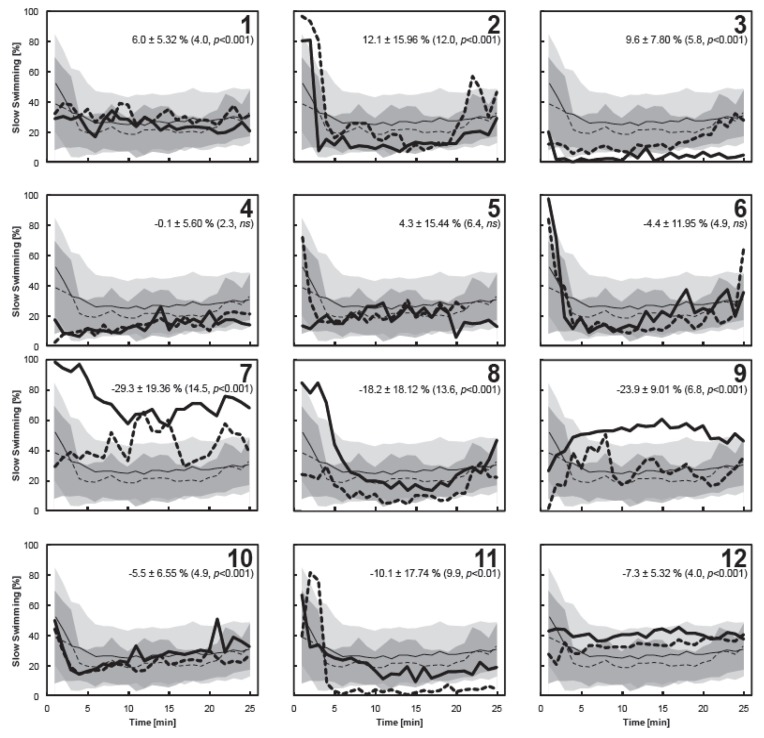
Figure 4.
The proportion of the time budget 12 individual copepods allocated towards slow swimming in high (thick dashed line) and low (thick solid line) DMS treatments. Each individual is displayed against the pooled data for the high and low DMS treatments with standard deviations shown as the shaded area as described in Figure 3. Values associated with each panel show the mean difference (±S.D.) between the paired treatments calculated from matched pairs analysis with the test statistic (tα/2) and the significance level (p) given in brackets; a positive value indicates copepods spent more time slow swimming in high DMS treatments (statistically significant in Copepods 1–3). Where the value is negative, copepods spent significantly more time slow swimming in Low DMS treatments (Copepods 7–12). Data for the last 4 min of the video sequence is missing for Copepod 5 in the high DMS treatment due to movement of the copepod out of the plane of camera focus.

