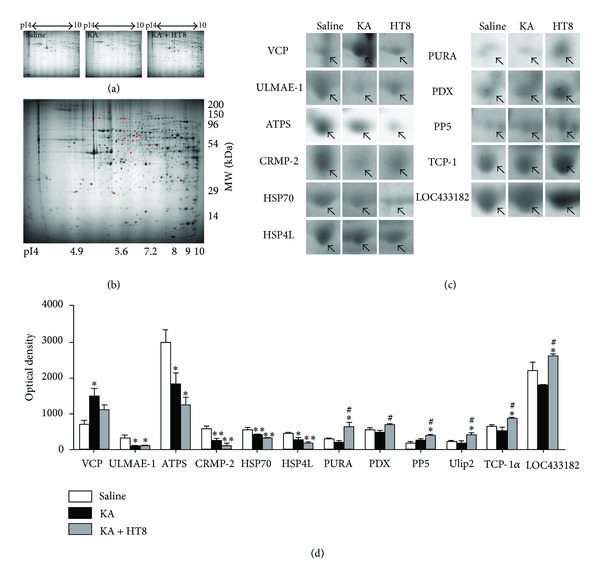
Figure 3.

Protein profiles with differential expression. (a) Hippocampal tissue protein profiles obtained over different pI ranges. (b) Representation of identified differential protein spots (red) in 2-DE gel templates among the saline, KA and KA + HT8 groups. (c) Differential expression profiles of 11 proteins. Arrowheads on cropped images of 2-DE gels represent protein spots that showed different changes among the saline, KA and KA + HT8 groups. (d) Quantitative analyses of downregulated or upregulated proteins by kainic acid (KA) and acupuncture stimulation at HT8. The spot intensities were derived from Coomassie-stained 2-D gels. VCP: valosin containing protein; ULMAE-1, ubiquitin-like modifier-activating enzyme 1 isoform 1; ATPS: ATP synthase subunit d; HSP70: heat shock 70 kDa protein 4L; HSP4L: heat shock protein 4 like isoform CRA_c; CRMP-2: dihydropyrimidinase-related protein 2; PURA: transcriptional activator protein Pur-alpha; PDX: pyruvate dehydrogenase protein X component; PP5: serine/threonine-protein phosphatase 5; TCP-1α: T-complex protein 1 subunit alpha; LOC433182: uncharacterized protein LOC433182. Data are expressed as the mean ± SEM. *P < 0.05 and **P < 0.01 versus the saline group. # P < 0.05 versus the KA group.
