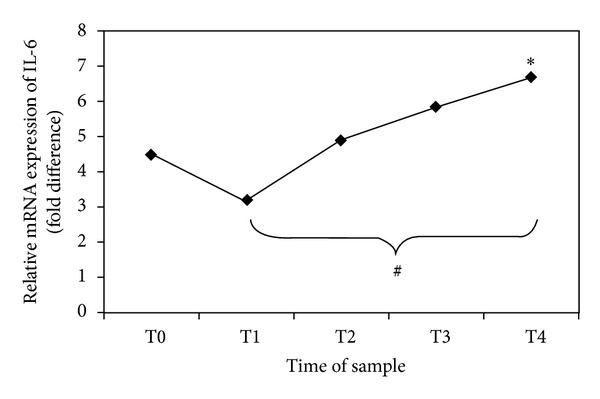
Figure 1.

Gene expression of IL-6 in PBMCs obtained by real-time PCR analysis. The points show the relative expression of the mRNA abundance of IL-6. The values on the y-axis represent arbitrary units derived from the mean expression value for the gene of septic patients compared with the healthy subjects set at 1 (not reported in the figure). *P = 0.031 trend of relative mRNA expression of IL-6 (ANOVA). # P = 0.030 T1 versus T4 (Bonferroni post hoc correction).
