Figure 2.

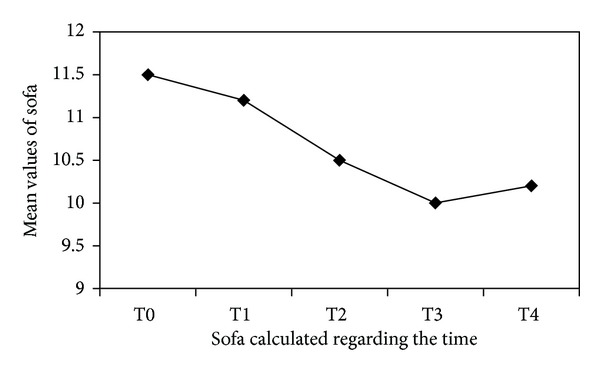
Mean values of daily SOFA measured for each patient. The points on y-axis represent that the mean values reach from this score during the time of treatment. The x-axis reported the different time of measurement.

Mean values of daily SOFA measured for each patient. The points on y-axis represent that the mean values reach from this score during the time of treatment. The x-axis reported the different time of measurement.