
Figure 3.
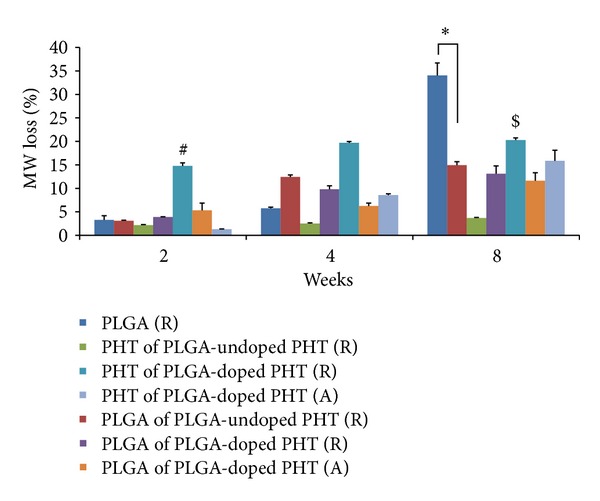
In vivo degradation of 2D random and 3D uniaxially aligned scaffolds as a function of molecular weight loss over time (2, 4, and 8 weeks); ∗ indicates the statistical significance with respect to PLGA of PLGA-doped PHT (A) at P < 0.05; #, $ indicate the statistical significance of PHT degradation in PLGA-doped PHT (R) with respect to PHT of PLGA-undoped PHT (R) and PHT of PLGA-doped PHT (A) at P < 0.05, respectively.