Figure 1. Real-time imaging of single signaling receptors in cilia of live cells.
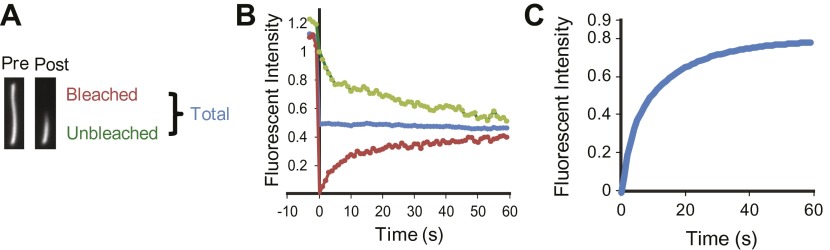
(A) Schematic of single molecule labeling strategy. SSTR3 or Smo were fused at the extracellular N-terminus to an acceptor peptide (AP) for the biotin ligase BirA. Biotinylated AP-SSTR3 and AP-Smo molecules were sparsely revealed by Alexa647-conjugated monovalent streptavidin (mSA-Alexa647) added at low concentrations (50 pM) to the extracellular medium. (B) IMCD3 cells stably expressing AP-SSTR3-GFP (SSTR3, pseudo-colored red, left panel) or AP-Smo-YFP (SMO, pseudo-colored red, right panel) were transfected with Pericentrin-RFP (PCNT, pseudo-colored blue) to mark the ciliary base and BirA to biotinylate AP-SSTR3-GFP. Biotinylated SSTR3 or Smo were detected with mSA-Alexa647 (mSA, pseudo-colored green). The kymograph represents the movement of a single mSA-Alexa647 labeled AP-SSTR3-GFP or AP-Smo-YFP in live cells. The tip (T) and the base (B) of the cilium are indicated. Scale bars, 2 μm (y), 4 s (x). (C) Kymographs of simultaneous live cell imaging of TagRFP.T-IFT88 (RFP-IFT88, IFT train) and single molecule SSTR3 (SSTR3:mSA-A647) movement in untreated cells. The mobility of ciliary SSTR3 was assessed by half-cilium FRAP (montage of heat-maps, bottom). Scale bars, 2 μm (y), 5 s (x). (D) Comparison of IFT88 foci track with single SSTR3 directional tracks in untreated cells. The processive movement of mSA labeled SSTR3 (SSTR3:mSA-A647, red dashed line) and IFT88 foci tracks (RFP-IFT88, green dashed line) are indicated. Little overlap is observed between IFT88 foci tracks and single SSTR3 tracks in untreated cells.
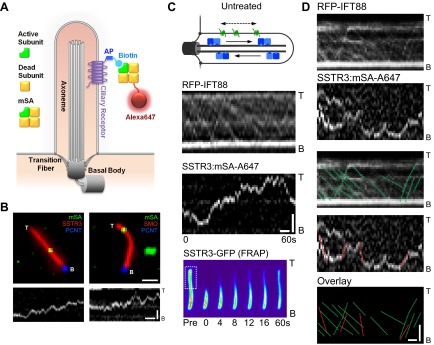
Figure 1—figure supplement 1. Additional kymographs.

Figure 1—figure supplement 2. Additional dual channel kymographs.
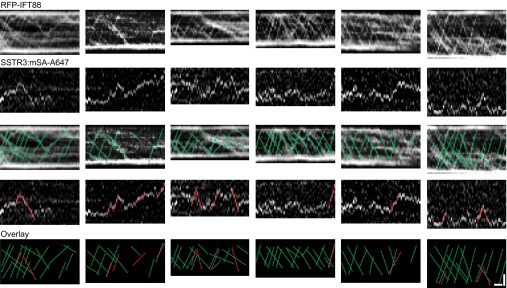
Figure 1—figure supplement 3. Half-cilium FRAP.