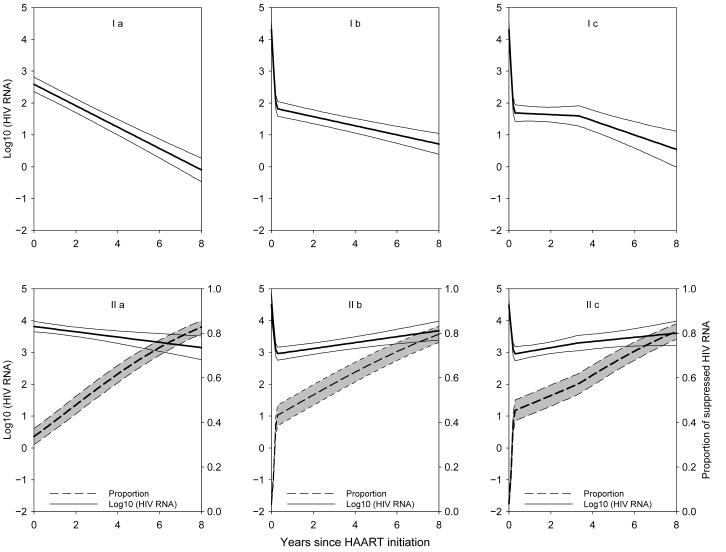
Figure 4.
Predicted trajectory for the WIHS based on the parameter estimates in eTable 3. Models Ia, Ib, Ic, IIa, IIb, and IIc correspond to the left-censored model (I) and the mixture model (II) respectively, with a) no change point, b) 1, and c) 2 change points, respectively. Dashed lines represent the estimated proportions of optimal or fully suppressed viral load, and solid lines represent the population averaged trajectory for those incompletely suppressed.

