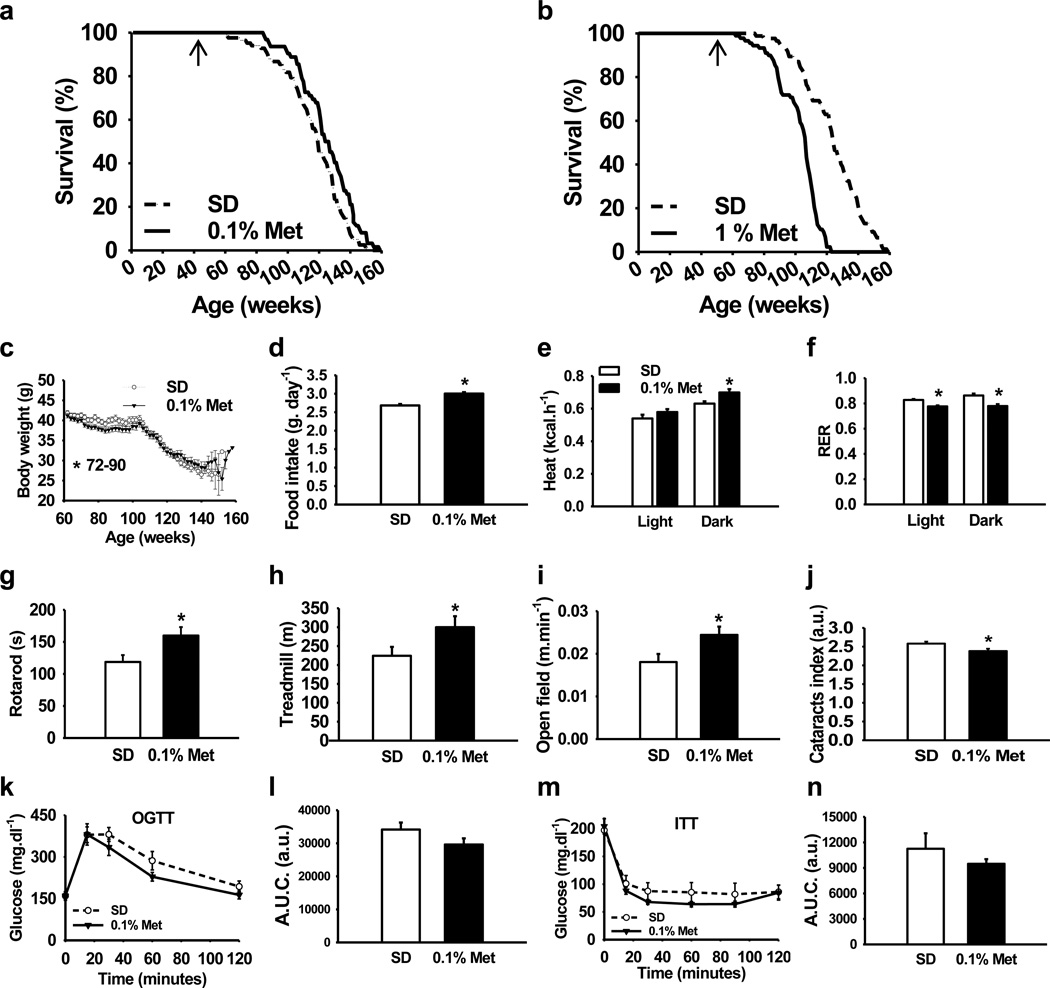
Figure 1. Metformin increases survival and improves physical performance.
(a, b) Kaplan–Meier survival curve for mice treated either with 0.1% or 1% metformin. n = 64 for metformin 0.1% group and n = 83 for their untreated counterparts; n = 90 for metformin 1% group and n = 88 for their untreated counterparts. The arrows at 54 weeks indicate the age at which metformin treatment was initiated. (c) Body weights. (d) Food consumption. (e, f) In vivo metabolic response to 0.1% metformin treatment. n = 9 per group. (e) Energy expenditure. (f) Respiratory exchange ratio. (g) Time to fall from an accelerating rotarod. n = 16 per group. (h) Distance ran on treadmill performance. n = 9 per group. (i) Average speed of animals in the open-field test. n = 15–16 per group. (j) Metformin treatment delayed the onset of age-related cataracts. n = 93–124 eyes per group. (k) Plasma levels of glucose after oral glucose load (OGTT). n = 8 per group. (l) Area under OGTT curve. (m) Plasma levels of glucose after intraperitoneal insulin injection (ITT). n = 9 per group. (n) Area under ITT curve. Metformin, Met. Unless otherwise stated n = all live animals in the study. Data are represented as the mean ± SEM. * p < 0.05 compared to standard diet (SD)-fed mice (t-test two tailed).

