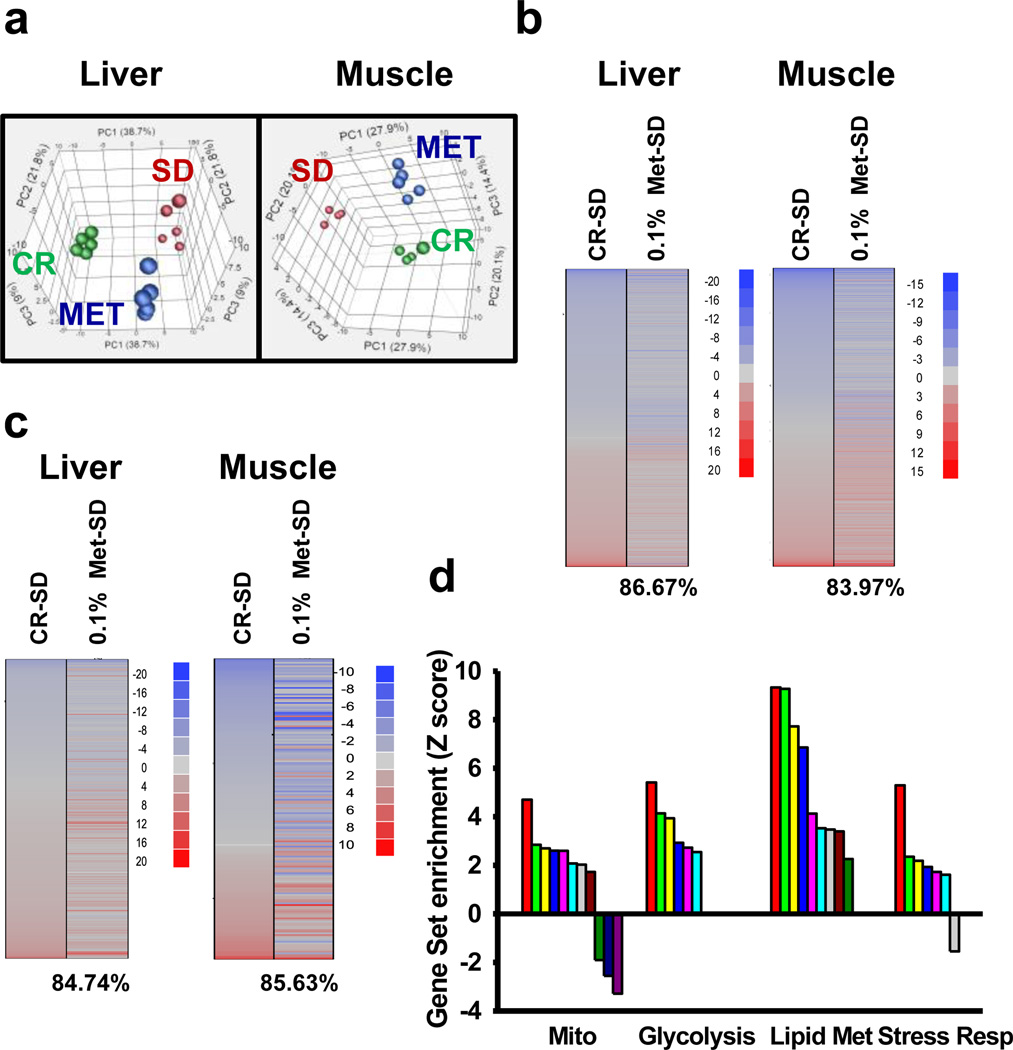
Figure 2. Metformin shifts expression patterns of mice towards those on calorie restriction.
(a) Principal component analysis (PCA) was performed on differentially expressed genes from the liver and muscle tissue of mice maintained on SD and 0.1% metformin. Each data point corresponds to the PCA analysis of each subject. (b) Gene expression profile comparing genes significantly up- (red) and down-regulated (blue) by either calorie restriction (CR) or metformin compared to SD mice (z-ratio). The percentage of significant gene expression changes shifted in the same direction in CR and metformin treatments compared to SD mice is presented in brackets. (c) Comparison of gene sets significantly altered by CR and metformin treatment compared to SD expression (z-score); up- (red) and down-regulated (blue) gene sets. The percentage of significant gene sets changes shifted in the same direction in CR and metformin treatments compared to SD mice is presented in brackets. (d) Effect of metformin on mitochondria (Mito), glycolysis, lipid metabolism (Lipid Met) and stress response (Stress Resp) related gene sets. The list of all the significantly modified gene sets can be found in Supplementary table S6. Metformin, Met; Calorie restriction, CR.

