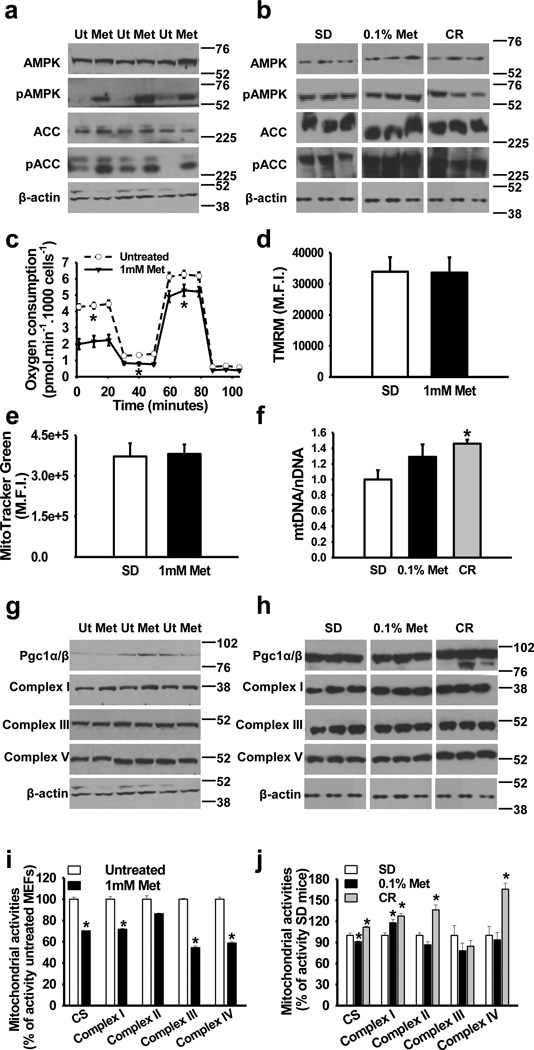
Figure 3. Metformin activates AMPK without altering in vivo electron transport chain activities.
(a) Activation of AMPK by metformin in MEFs. AMPK and acetyl-coA carboxylase (ACC) phosphorylation by metformin. n = 3 per group. (b) Activation of AMPK and ACC phosphorylation in the liver of 0.1% metformin-treated mice. n = 4–6 per group. (c) Oxygen consumption in MEFs treated with 1 mM metformin. n = 3 per group. (d, e), Mitochondrial content in MEFs treated with metformin was determined by tetramethyl rhodamine methyl ester (TMRM) (d) and MitoTracker green (e) staining, M.F.I., mean fluorescence intensity. n = 3 per group. (f) Mitochondrial DNA content analyzed by quantitative PCR in the liver. n = 5–8 per group. (g) Mitochondrial protein levels in MEFs treated with metformin. n = 3 per group. (h) Mitochondrial protein levels in the liver from 0.1% metformin-treated mice. n = 4–6 per group. (i, j) Effect of metformin on mitochondrial enzymatic activities. (i) MEFs treated with 1 mM metformin (n = 3 per group) and (j) Liver lysates from 0.1% metformin-treated mice (n = 5–6 per group). Metformin, Met: Calorie restriction, CR; Ut, untreated. Data are represented as the mean ± SEM. * p < 0.05 versus untreated controls or standard diet (SD)-fed mice (t-test two tailed).

