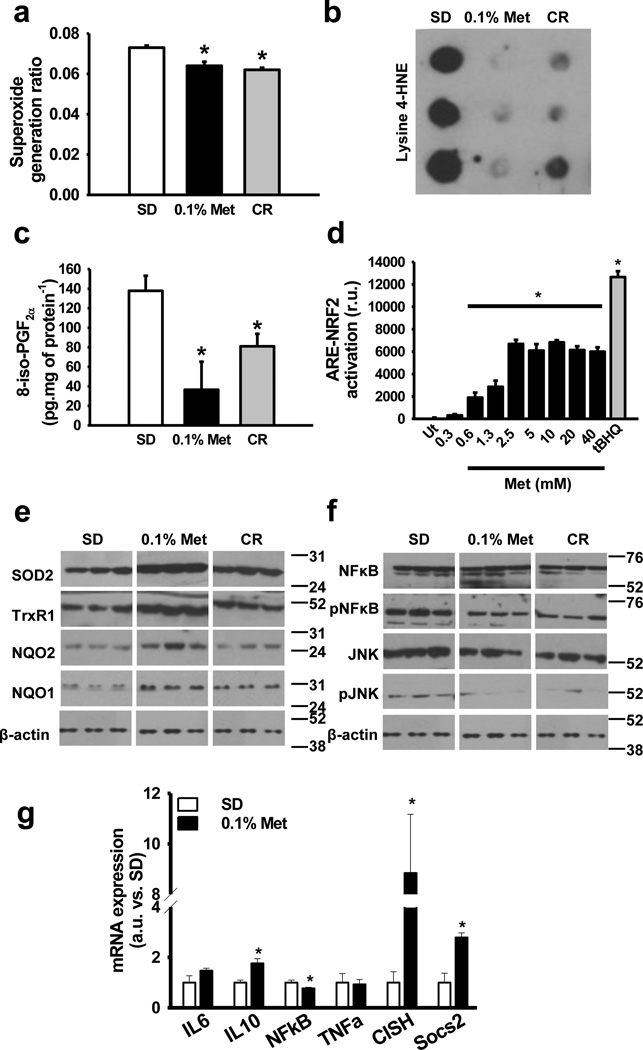
Figure 4. Metformin enhances antioxidant defenses and inhibits inflammation.
(a) Rate of electrons derived to superoxide generation in mitochondrial complexes I and II to III in the liver of 0.1% metformin-treated mice. n = 5–6 per group. (b) Oxidative damage in proteins determined by lysine-4-hydroxinonenal levels in the liver of 0.1% metformin-treated mice. (n = 4–6 per group) (c) Oxidative damage in lipids determined by 8-iso-PGF2α levels in the liver of 0.1% metformin-treated mice. (n = 4–6 per group) (d) Nrf2-ARE assay determining Nrf2-ARE-dependent expression in metformin-treated HepG2 cells. tBHQ was added as positive control for NRF2-ARE induction. (n = 3 per group) (e) Antioxidant and stress response protein levels in the liver of 0.1% metformin-treated mice. (n = 4–6 per group) (f) Activation of pro-inflammatory signaling pathways in the liver of 0.1% metformin-treated mice. (n = 4–6 per group) (g) Expression of multiple inflammatory-related genes in the liver of 0.1% metformin-treated mice. (n = 5 per group) Metformin, Met; Calorie restriction, CR. Data are represented as the mean ± SEM. * p < 0.05 versus standard diet (SD)-fed mice (t-test two tailed).

