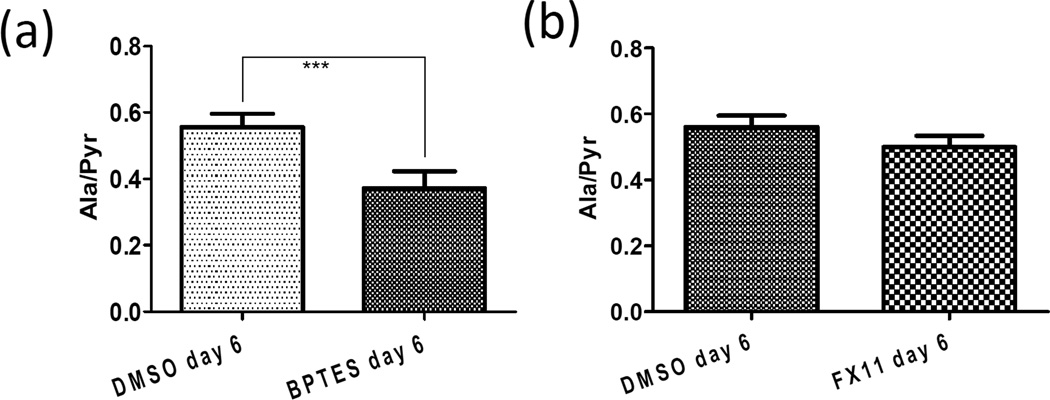
Figure 4.
Differences in Alanine-to-Pyruvate flux ratio (Ala/Pyr) between (a) DMSO and BPTES groups (n = 8 for each group, error bars = s.d. from the mean, p<0.001) and (b) DMSO and FX11 groups (n = 8 for each group, error bars = s.d. from the mean, p = 0.112). Table I summarizes the FX11 and DMSO treatment response in terms of Lactate-to-Pyruvate flux ratio ((Lac/Pyr) and conversion rate constant ratio (kp/kL).

