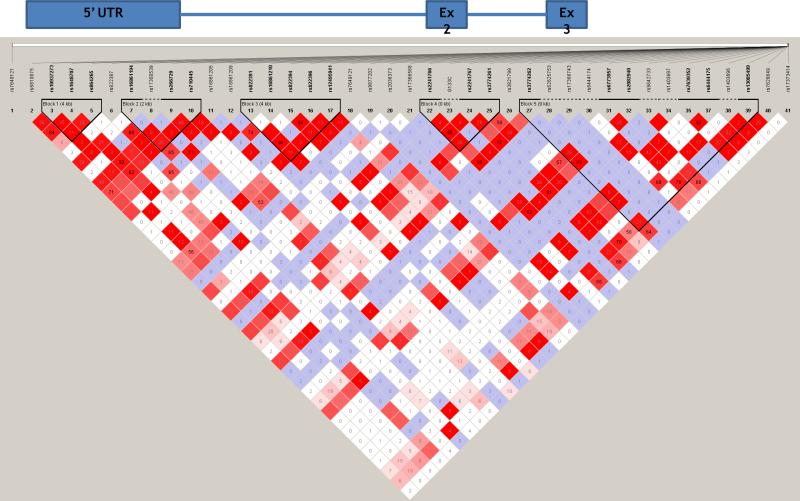
Figure 1.
Gene map of ADIPOQ matched to the haploview-generated LD matrix for ADIPOQ +/−50kb in the Hispanic IRASFS sample. Figures generated with Haploview 4.0. Regions of high LD (D’ = 1 and logarithm of odds [LOD]>2) are shown in the darkest shade. Markers with lower LD (0.45<D’<1 and LOD>2) are shown in dark through light shades, with the color intensity decreasing with decreasing D’ value. Regions of low LD and low LOD scores (LOD<2) are shown in white. The number within each box indicates the r2 statistic value between the corresponding two SNPs. Black triangles represent LD blocks based on the confidence intervals [Gabriel, et al. 2002].

