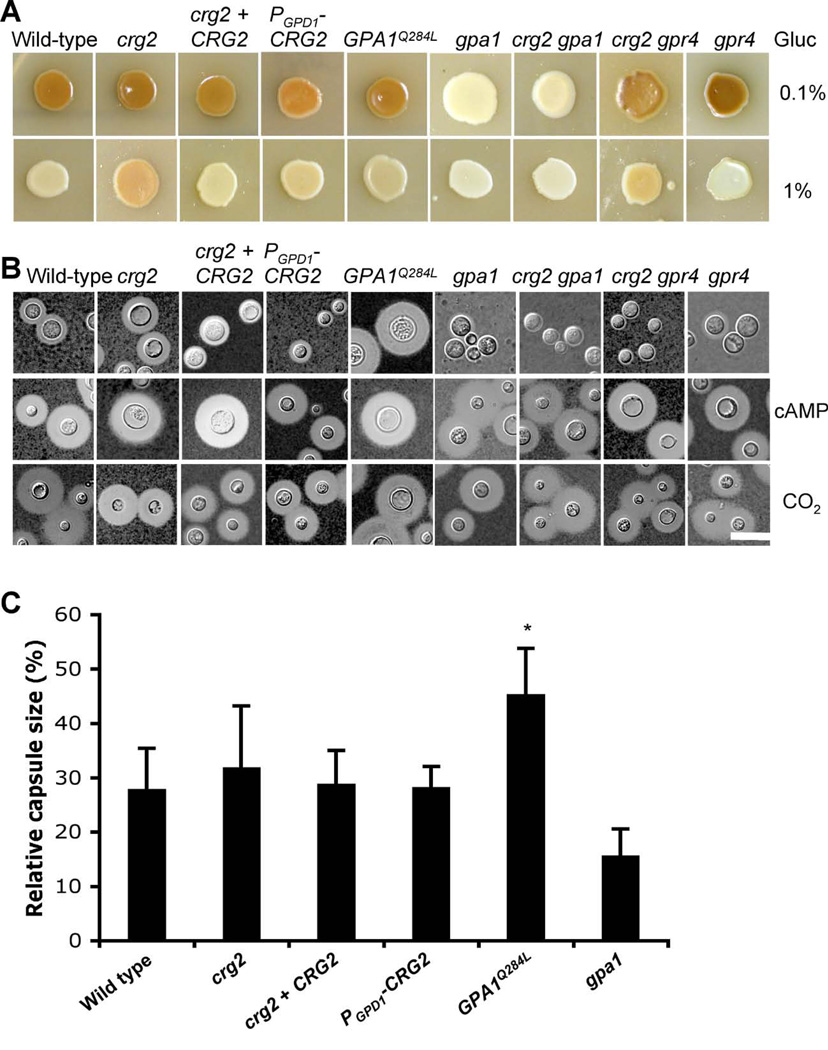
Figure 5. Melanin and capsule production increase in crg2 mutants.
A) Melanin production was assayed on Niger seed media containing 0.1% of glucose (upper panel), or 1% glucose (lower panel). Melanin levels produced by the strains tested on these two media were photographed after incubation for 3 days at 37°C. B) Capsule formation was assayed under three different conditions. Cells were incubated at 37°C on DME medium (upper panel), DME medium containing 10 mM cAMP (middle panel), and DME under 4 to 10% CO2 conditions (lower panel). Capsule production was visualized by India ink staining after growth on these media for 3 days. Bar, 10 µm. C) Quantitative measurement of the relative capsule diameter under standard conditions (See materials and Methods). Each data point and error bar indicates the standard error of the mean for more than 50 cells. Statistical analysis was performed based on a student’s t-test. * indicates statistical significance (P<0.05).

