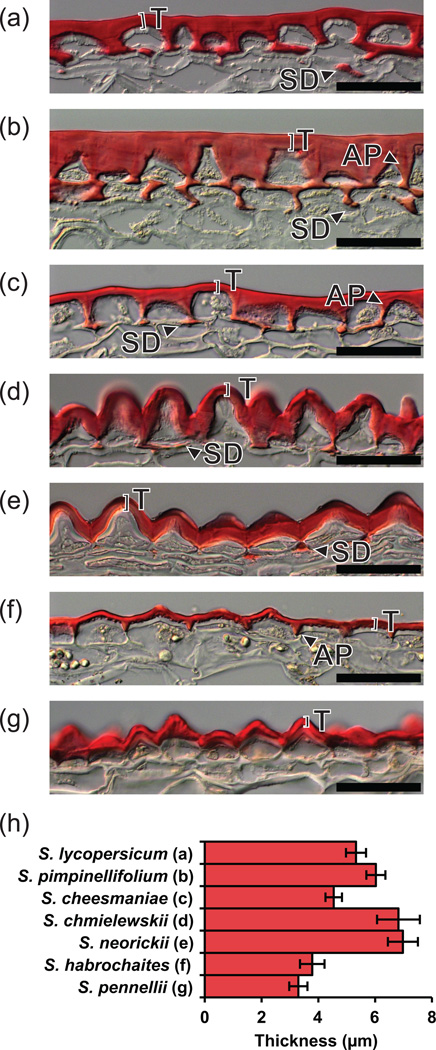
Figure 2. Two-dimensional cuticle morphology.
(a–g) Light micrographs of sections of the fruit surface of tomato (S. lycopersicum) and six wild relatives, showing the cuticle stained with Oil red O. Scale bars = 50 µm. T, Thickness; SD, Subepidermal cuticular deposit; AP, Anticlinal peg. The species represented in each panel is shown in panel H of this figure. (h) Cuticle thickness measurements. Measurements were made above the center of each epidermal cell as indicated by bars labeled “T” in panels A–G. Error bars are S.E. for n=5.

