
Figure 3.
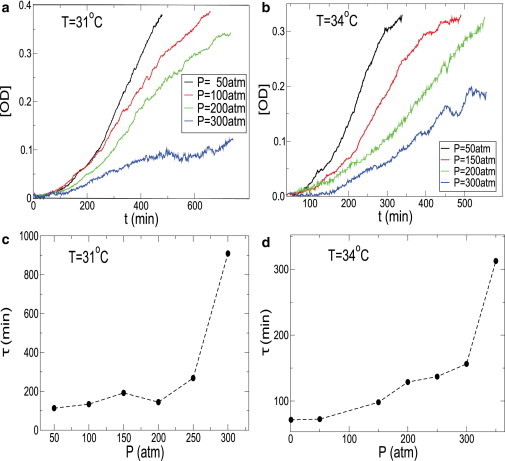
(a) Growth curves at different pressures for T = 31°C. (b) Growth curves at different pressures for T = 34°C. (c) Doubling time τ(P) extracted from Fig. 3a. (d) Doubling time τ(P) extracted from Fig. 3b. Pressure dependence of τ(P) is marked by a sharp increase at high pressures where the cells still grow, but the growth is extremely slow.