
Figure 5.
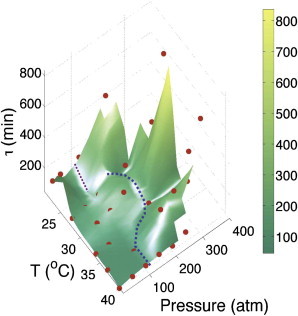
Pressure-temperature surface plot of doubling time τ(P,T). (Solid red circles) Experimental data points. (Blue dotted line) Loci of the points where τ changes abruptly. (Purple dotted line) dP/dt < 0 is the region separating anomalous pressure dependence of the doubling time. (Color bar) Value of τ in minutes.