
Figure 7.
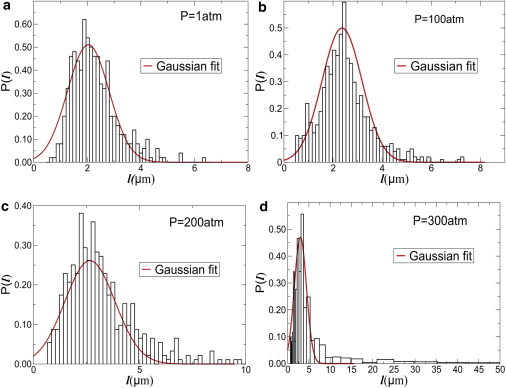
Histogram of length of bacterial cells at different pressures for T = 31°C: (a) 1 atm, (b) 100 atm, (c) 200 atm, and (d) 300 atm. Also shown are the Gaussian fits to the distribution. At high pressures, the distribution P(l) becomes increasingly non-Gaussian and develop a long tail.