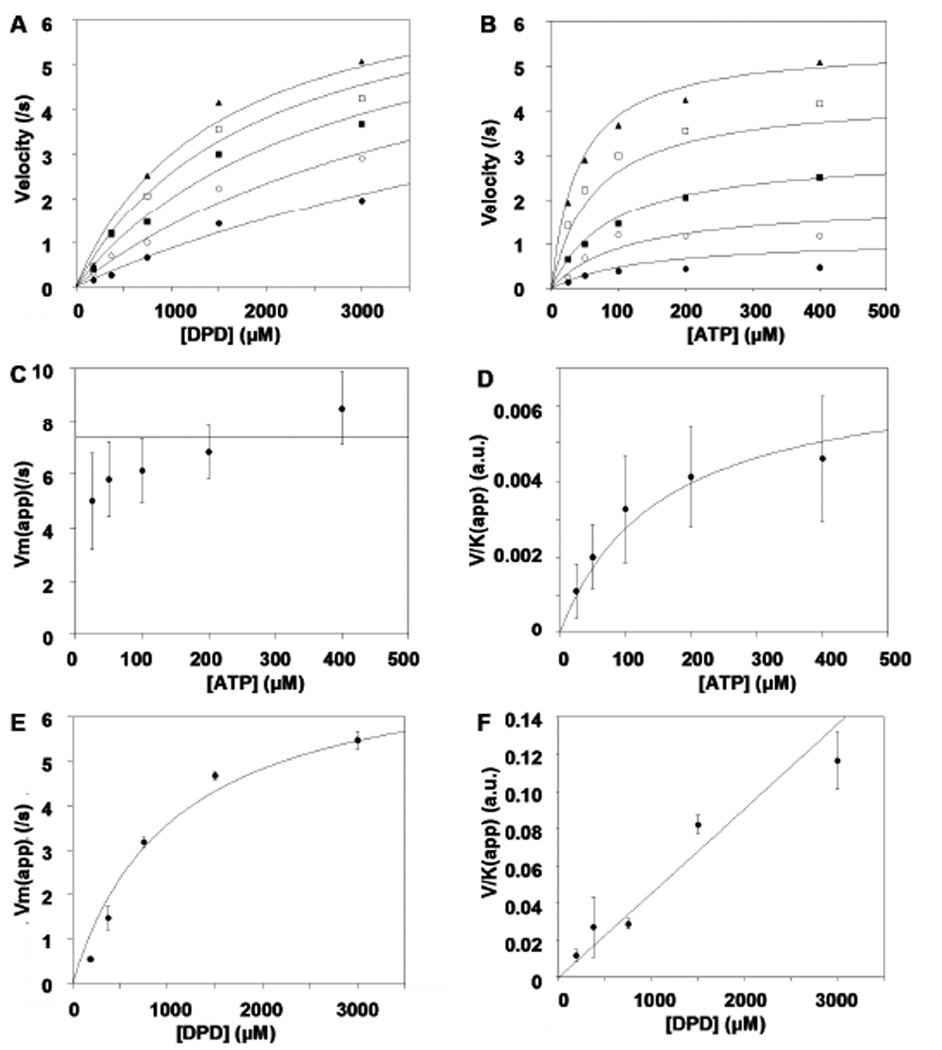
Figure 2.
Global fit of a rapid equilibrium ordered mechanism with ATP binding first to LsrK. Panels A & B present the velocity saturation curves versus [DPD] at varying [ATP] (circle, 25 µM; solid circle 50 µM; square 100 µM; solid square 200 µM; solid triangle 400 µM) (A) and [ATP] at varying [DPD] (circle, 187.5 µM; solid circle 375 µM; square 750 µM; solid square 1500 µM; solid triangle 3000 µM) (B) to the matrix of substrate concentrations. Panels C–F present re-plots of parameters (Vmax)apparent and (V/K)apparent obtained from individually fit saturation curves to one substrate at fixed concentrations of the second substrate. Curves depicted are the best fit results using the parameters from the global fit. Error bars represent standard deviation.

