Figure 4.
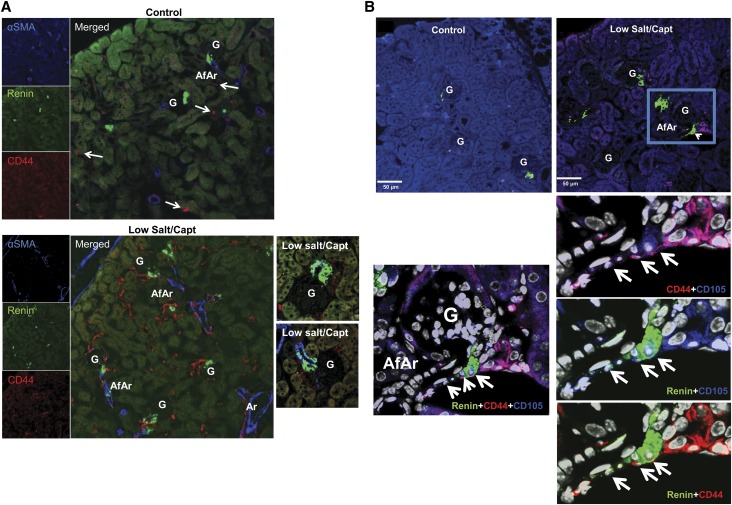
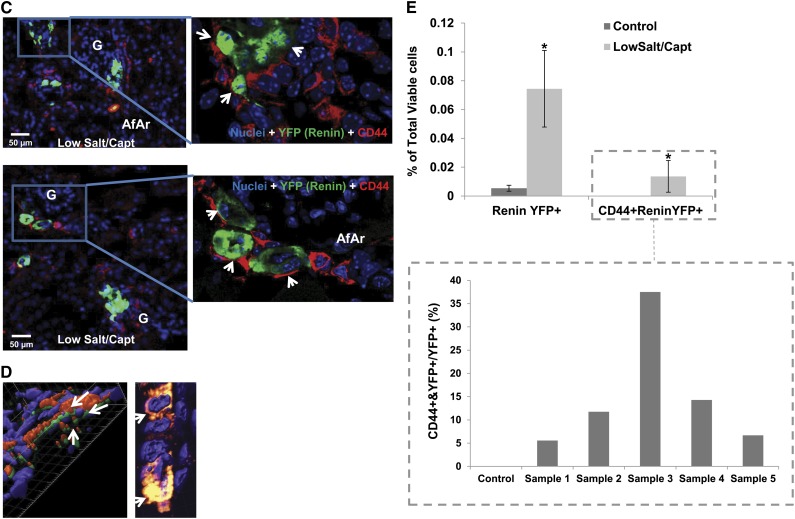
Mouse renal CD44+ MSC-like cells contribute to JG cell recruitment. C57BL/6 wild-type or Ren1c YFP male mice (6–8 weeks old) were administered a low-salt/captopril or normal diet for control, as described in the Material and Methods section. (A) Representative 14× confocal images of kidney sections stained with α-smooth muscle actin (α-SMA; blue), CD44 (red), or renin (green) from control and treated mice. Upper panel: control untreated mice; lower panel: low-salt/captopril (Capt)–treated mice. Magnifications highlighting the presence of renin-positive CD44 cells in low-salt/captopril–treated mice are shown in the right. AfAr, afferent arteriole; Ar, artery; G, glomeruli. White arrow points to CD44+ cells under basal conditions. (B) Upper: Representative 14× confocal images of kidney sections stained with CD105 (blue), CD44 (red), or renin (green) from control and treated mice as in A. Lower: Magnifications from above highlighting the coexpression of CD105 and CD44 markers with renin (arrows). (C) Left: Representative images (16×) of kidney sections from low-salt/captopril–treated Renin1c-YFP animals, highlighting the presence of double-positive CD44 (red)- and YFP (green)-expressing cells. Right panels show zooms (magnification, ×40) to specific areas with CD44 and YFP double-positive cells (arrows). (D) Three-dimensional reconstruction of confocal microscopy images (magnification ×40) of kidney sections from Ren1c YFP mice treated with low-salt/captopril using Imaris software. Arrows show cells that coexpress CD44 and YFP. Note that the CD44 staining localizes to the cell membrane and YFP is cytosolic. Right: Three-dimensional projection of same image as C, allowing detection of yellow color denoting coexpression of CD44 and YFP in the cells. (E) FACS analysis of isolated mouse kidney cells using anti-CD44 antibody, and YFP expression. The bar graph in the left presents the percentages of YFP+ and CD44+/YFP+ double-positive cells versus total cells in the kidneys of control and low-salt/captopril–treated mice. Data presented as the mean and SEM; *P<0.05 low-salt/captopril mice versus control. The individual sample values for the CD44+/YFP+ represented as percentage of double-positive CD44+/YFP+ cells versus total YFP+ cells (renin-expressing cells) are shown at the bar graph in the boxed area.


