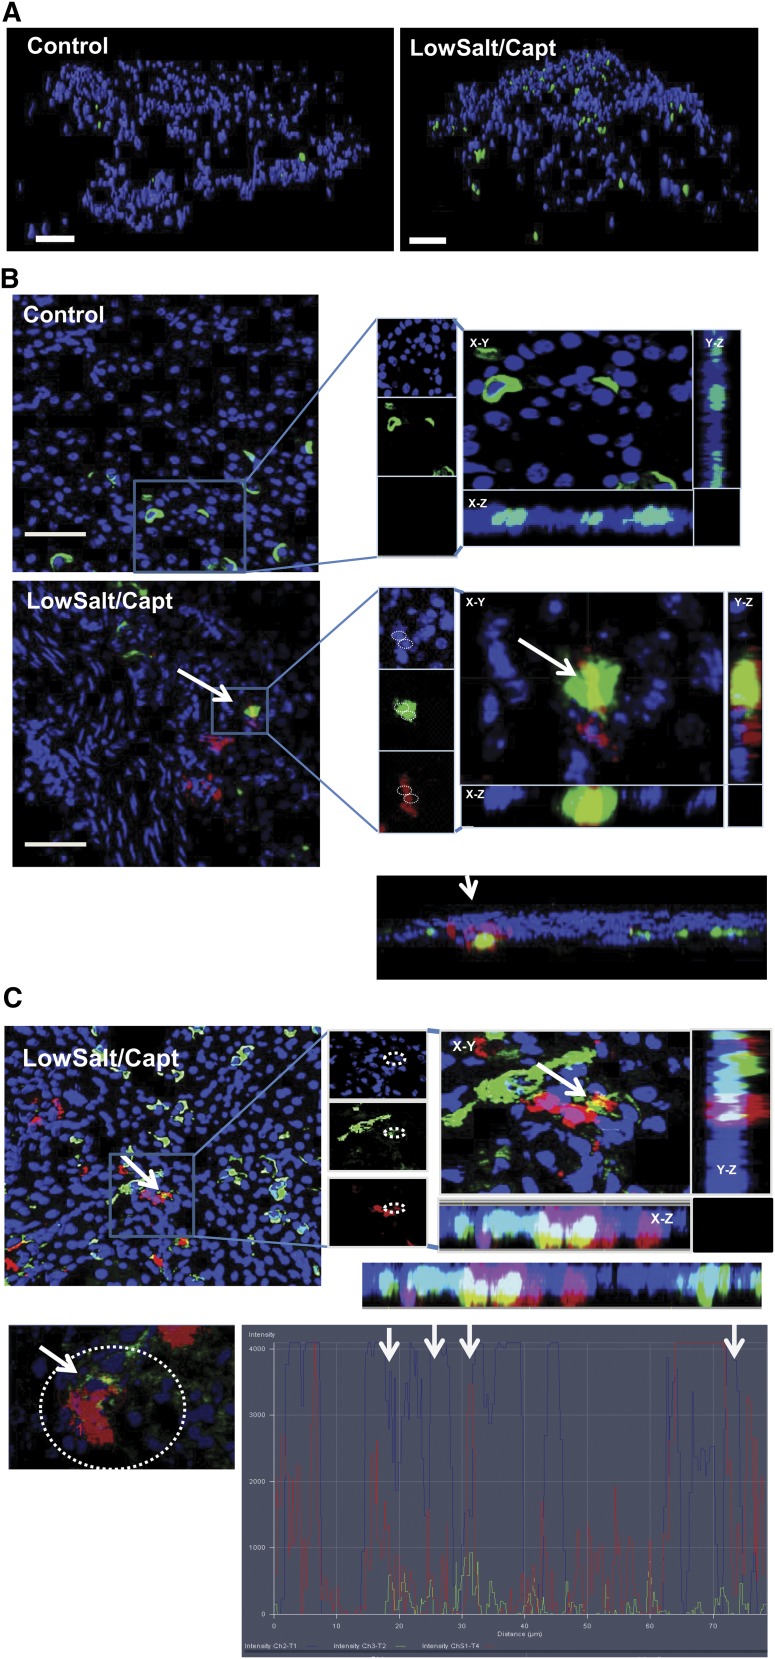
Figure 5.
Lineage tracing confirms contribution of adult renal c-kit+ MSC-like cells to JG cell recruitment. c-KitCre-ERT2 GFP/Rosa tdTomato mice were treated with tamoxifen, followed by low-salt/captopril treatment, as described in the Materials and Methods section. (A) Isosurface rendering of representative multiphoton microscopy images from the kidney of treated or untreated control mice. c-Kit+ (GFP-green) and nuclei (blue). Scale bar, 50 µm. (B) Confocal microscopy images of kidney JG area from control mice or treated mice; c-Kit lineage cells (GFP-green), renin (red), and nuclei (blue). Orthogonal slides of three-dimensional (3D) reconstructed images at all three different planes allows visualization of coexpression of fluorescence signals renin (red) and GFP (green), ensuring that the yellow signal is not due to cell stacking. (Original magnification, 40× in X-Y, X-Z and Y-Z planes.) Below orthogonal slide: Imaris 3D clipping plane reslicing of the low-salt/captopril image from above showing coexpression of GFP and renin inside the cells is presented. Panels show merged signal (yellow). (C) Top: Representative orthogonal slides of 3D reconstructed image from low-salt/captopril–treated kidney showing an area of cells coexpressing renin with c-Kit. Bottom: Confocal microscopy image (×20) from selected area from above and signal profile analysis for nuclei (blue), c-Kit (green), and renin (red) allowing for detection of cells coexpressing renin and CD44 in the area. (Specific places were blue, green, and red localized to the same place on the image, highlighted by arrows).

