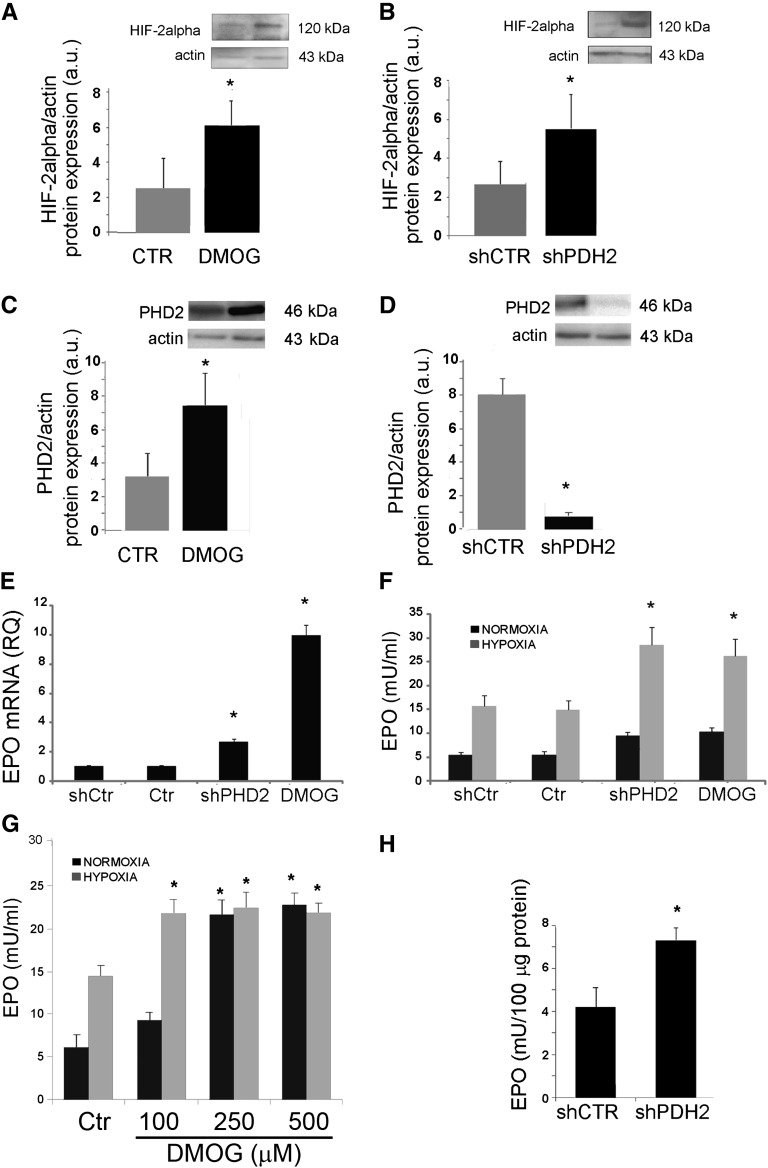
Figure 4.
Increase in EPO released by CD133+/CD73+ cells after PHD2 inhibition. CD133+/CD73+ cells are infected with shRNA for PHD2 (shPHD2) or with scrambled vector (shCtr) or treated with DMOG (100 μM for 24 hours). (A–D) Western Blot micrographs and densitometric analysis of HIF-2α (A and B) and PHD2 (B and D) expression. Data, shown as arbitrary units, are representative of three different experiments performed using three different cell isolates and are normalized to actin expression. (E) Quantitative RT-PCR analysis showing increase in mRNA encoding for EPO in shPHD2 and DMOG treated CD133+/CD73+ cells. (F and G) EPO release by shPHD2 and DMOG treated CD133+ cells in normoxia or hypoxia. Data are the mean ± SD of experiments performed in triplicate using three (shPHD2) or six (DMOG) different cell isolates. (H) Detection of EPO in the cell lysates of shCtr and shPHD2 cells in normoxia or hypoxia. Data are the mean ± SD of three different experiments. The t test is performed. *P<0.05 DMOG versus Ctr or shPHD2 versus shCtr.

