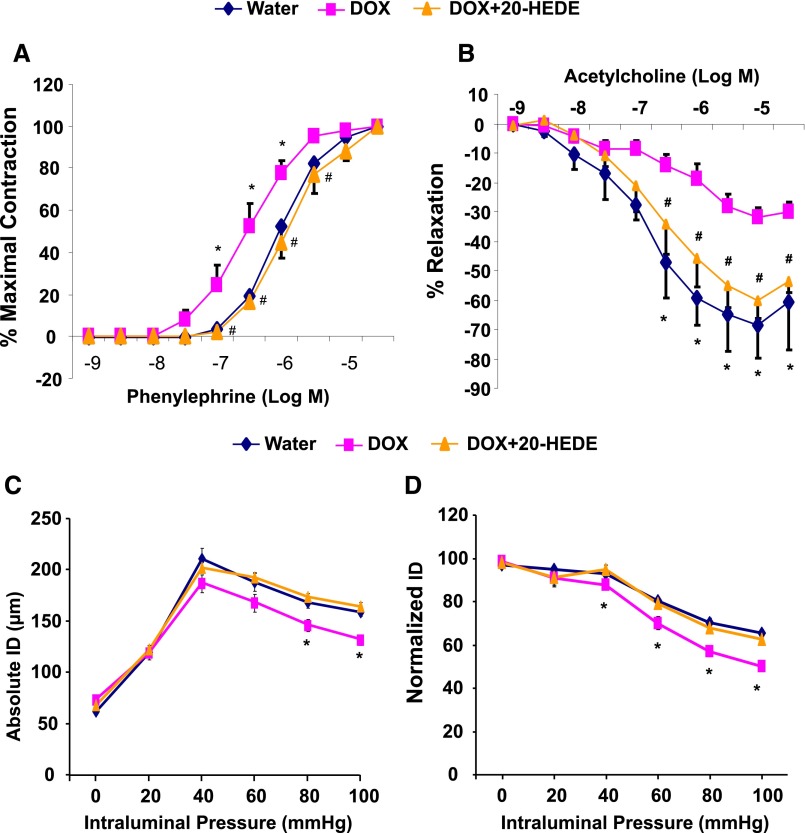
Figure 7.
Vascular function in microvessels from Cyp4a12tg mice. Cumulative concentration-response curve to phenylephrine (A) and acetylcholine (B) in renal interlobar arteries. Effect of stepwise increments in intraluminal pressure on the absolute (C) and the normalized (D) internal diameter (ID) in third branch of mesenteric arteries (n=4–6). *P<0.05 versus water; #P<0.05 versus DOX.

