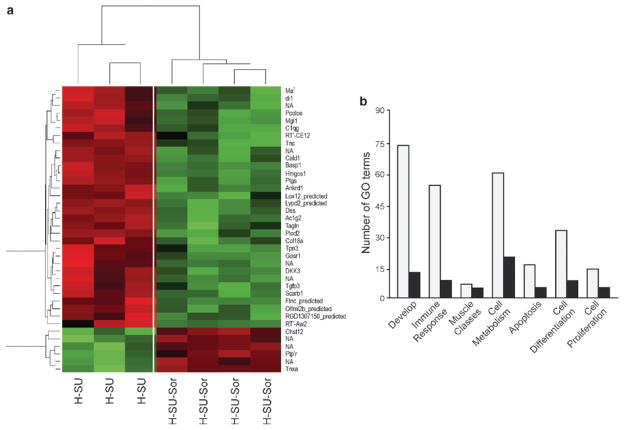
Fig. 27.4.
Heat map and gene ontology (GO) depiction of sorafenib-driven differentially regulated transcripts in the hypoxia-SU5416 pulmonary hypertension rodent model. (a) Microarray analysis of Dahl SS rat lungs (n = 4 chips/group) at 3.5 weeks revealed 38 differentially regulated transcripts between the hypoxia/SU5416 groups with and without sorafenib intervention. These 38 transcripts were assessed for significant directional expression pattern, yielding six genes that appeared across all four conditions. These six genes (Cald1, Pcolce, C1qg, Idi1, Tgfβ3, Ptgis) consistently displayed an increase in expression levels in hypoxia compared to normoxia, with greater expression level in the hypoxia/SU5416 model of PH. In each case, a reduction in gene expression was observed following sorafenib to levels comparable to normoxia. These transcripts were then clustered with a conventional heat map analysis with red blocks representing upregulation and green blocks representing downregulated expression of the relative transcript. (b) The transcript names were manually highlighted to show the significantly enriched GO classes that fell into the six most highly represented general categories and GO superclasses: “Developmental processes,” “muscle development and regulation of muscle contraction,” “defense response/immune system,” “cell proliferation,” “cell differentiation,” and “cellular metabolic processes/metabolism” and apoptosis

