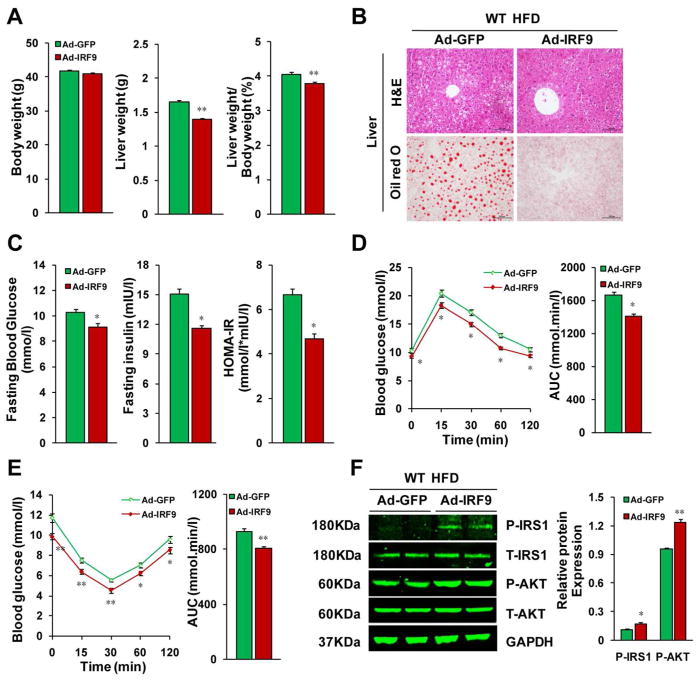
Figure 4. Hepatic IRF9 overexpression improves metabolism in diet-induced obese mice.
(A) Body weight, liver weight and the liver to body weight ratio of WT mice fed with HFD were examined. These mice were either injected with IRF9 adenovirus or GFP adenovirus control, n=12–13 per group. (B) Representative liver sections stained with H&E (top panel), Oil-red O (lower panel) of IRF9 overexpressed and vector control mice fed with HFD. (C) Fasting blood glucose levels were detected with food deprivation for 6 hours. Serum fasting insulin levels were determined by ELISA. HOMA-IR index was also calculated. n=6 per group. (D) A glucose tolerance test (GTT) (1 g/kg body weight, glucose intraperitoneal injection) was performed on HFD fed WT mice injected with IRF9 adenovirus or vector control virus. The corresponding area under the curve (AUC) of blood glucose levels in each group was calculated, n=12–13 per group. (E) An insulin tolerance test (ITT) (0.75 units/kg body weight, insulin intraperitoneal injection) was also performed. The corresponding area under the curve (AUC) of blood glucose levels in each group was calculated, n=12–13 per group. (F) Immunoblot analysis indicated that the reverse insulin resistance in mice with IRF9 liver-specific overexpression and displayed marked upregulation of the phosphorylation of IRS1-tyr608 and Akt in liver. Quantification of the phosphorylated protein expression levels were normalized to GAPDH, n= 4 per group. All values are expressed as mean ± SEM. The statistical significance is indicated and compared with the GFP adenovirus injected group, *p < 0.05, **p < 0.01.

