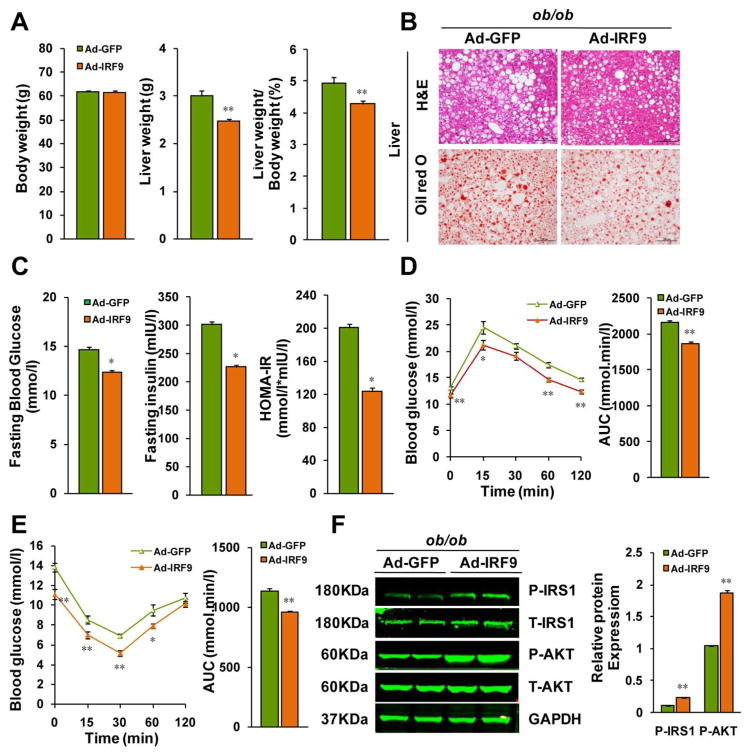
Figure 5. Hepatic IRF9 overexpression improves metabolism in ob/ob mice.
(A) Body weight, liver weight and the liver to body weight ratio of ob/ob mice injected IRF9 or GFP adenovirus were examined. n=12 per group. (B) Representative liver sections stained with H&E (top panel), Oil-red O (lower panel) of IRF9 overexpressed and GFP control ob/ob mice. (C) Fasting blood glucose levels were detected with food deprivation 6 hours. Serum fasting insulin levels were determined by ELISA. HOMA-IR index was also calculated. n=6 per group. (D) A glucose tolerance test (GTT) (1 g/kg body weight, glucose intraperitoneal injection) was performed on ob/ob mice. The corresponding area under the curve (AUC) of blood glucose levels in each group was calculated, n=12 per group. (E) An insulin tolerance test (ITT) (0.75 units/kg body weight, insulin intraperitoneal injection) was also performed. The corresponding area under the curve (AUC) of blood glucose levels in each group was calculated, n=12 per group. (F) Immunoblot analysis of the phosphorylation of IRS1-tyr608 and Akt in livers. Quantification of the phosphorylated protein expression levels were normalized to GAPDH, n= 4 per group. All values are expressed as mean ± SEM. The statistical significance is indicated and compared with the GFP adenovirus injected group, *p < 0.05, **p < 0.01.

