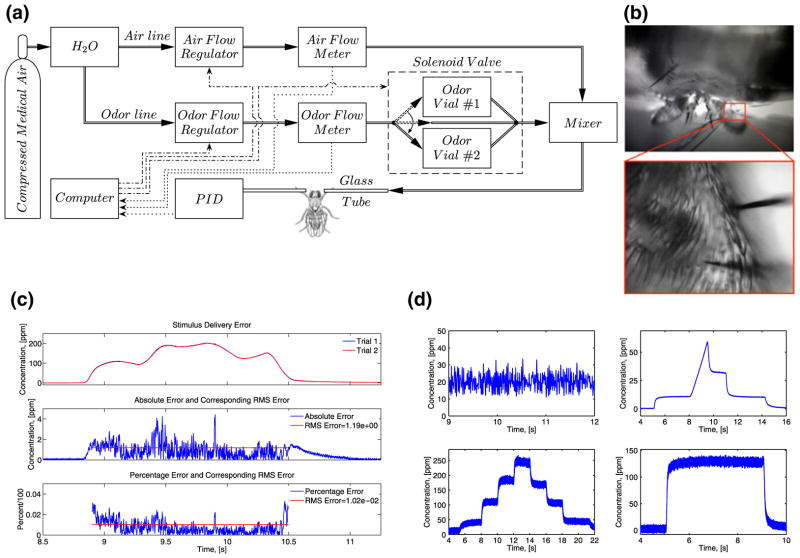
Fig. 1.
The experimental setup. (a) The block diagram of the odor delivery system. (b) Top: the fly head and antennae as seen under the microscope; bottom: two electrodes are placed into two distinct sensilla for simultaneous in-vivo extracellular recordings. (c) The tolerance of the stimulus reproducibility is 1%. (d) The setup allows to deliver a variety of odor concentration waveforms

