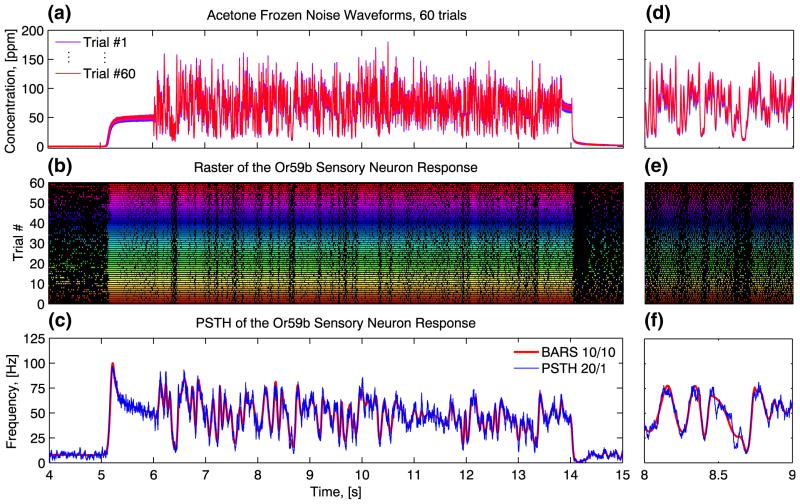
Fig. 4.
The OSN response to the acetone frozen noise odor waveform. (a) 60 consecutive presentations of the frozen noise odor waveform. Note the remarkable reproducibility in odor delivery. (b) The corresponding raster of the OSN response. A different color is used for each trial # to highlight that in repeated trials the delivered odor waveforms differ by up to 1%. (c) The PSTH of the OSN response to the frozen noise waveform was computed using a 20 ms bin size and a 1 ms sampling interval. The BARS algorithm applied to a PSTH with non-overlapping 10 ms bins provides an additional estimate of the neural response. (d)(f) A one-second-long window from (a)–(c)

