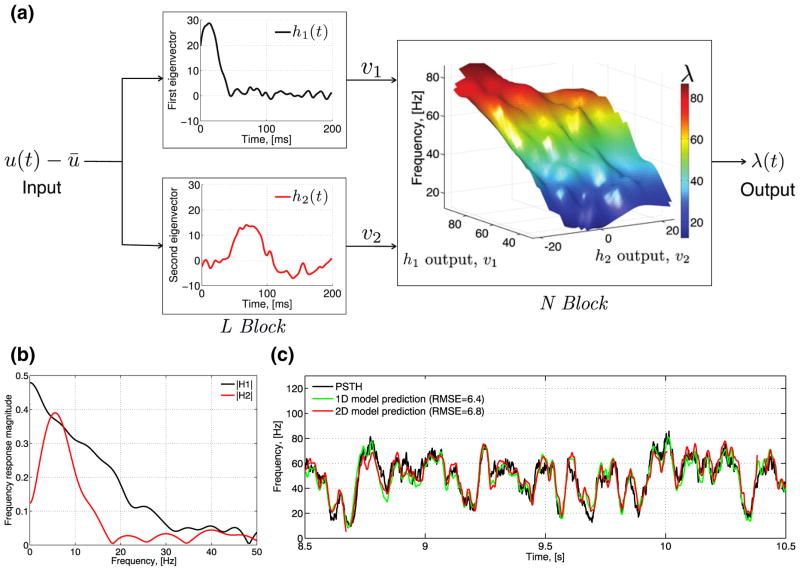
Fig. 6.
The two-dimensional LNP cascade model of the Or59b OSN. (a) The block diagram of the 2D LNP cascade model. The model input u(t) − ū is filtered with two kernels h1 and h2 and the filter outputs υ1 and υ2 are passed through a static 2D nonlinearity. The model output (t) is the random intensity rate of the spike train. The OSN kernels h1 and h2 were estimated using the STC method. (b) The Fourier transform of the filters (H1 and H2) shows that h1 is a low-pass filter with a cutoff frequency of about 20 Hz and h2 is a band-pass filter with cutoff frequencies at roughly 1 Hz and 12 Hz. (c) The cross-validation shows that the 2D LNP cascade model can closely predict the OSN PSTH in response to novel noise stimuli with the same mean μ = 68 ppm and contrast σ/μ = 0.38. The RMSE between the PSTH (black) and the estimated random intensity rate of the spike train (red) is 6.8 Hz. For comparison, the 1D LNP model prediction is shown in green. The RMSE between the PSTH (black) and the estimated random intensity rate of the spike train (red) is 6.4 Hz

