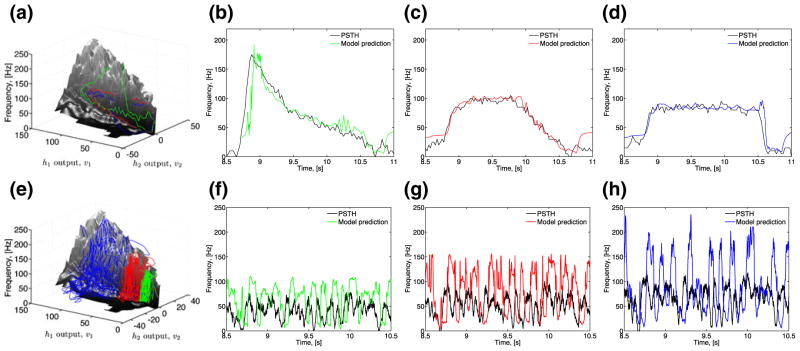
Fig. 9.
Using the 2D Encoding Manifold to predict the response of an OSN. (a) Three arbitrary triangle odor waveforms (green, red and blue) mapped onto the 2D Encoding Manifold (black). Sample odor waveforms are shown in Fig. 3(b). (b)–(d) Cross-validation using the three arbitrary triangle waveforms (green, red and blue) and the OSN PSTH (black). (e) White noise odor waveforms mapped onto the 2D Encoding Manifold. The white noise odor waveforms have the mean contrast pairs (58, 0.1) in green, (62, 0.19) in red, and (67, 0.26) in blue, respectively. (f)–(h) Cross-validation of three white noise odor waveforms (green, red and blue) and the corresponding OSN PSTH (black)

