
Figure 7.
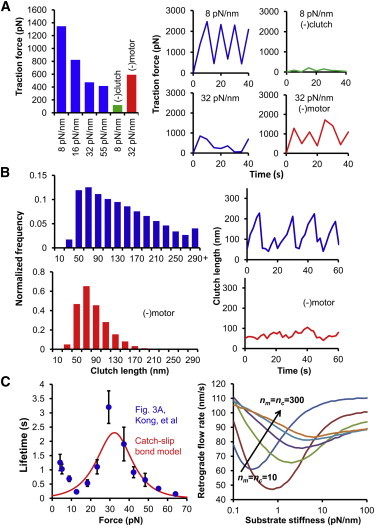
Experimental validation of the motor-clutch model. (A) As in Plotnikov et al. (30), the motor-clutch model produces either fluctuating or stable traction forces depending on the conditions. Parameters were adjusted to show decreasing traction force on substrate stiffnesses ranging from 8 to 55 pN/nm. Over this range the traction dynamics also shifted from fluctuating traction to stable traction (blue). Reduction of the number of clutches on 8 pN/nm resulted in stable traction (green), whereas reduction of the number of motors on 32 pN/nm resulted in fluctuating traction (red). (B) Clutch extension histograms and dynamics show behavior similar to that seen in Margadant et al. (31). Clutch length shows a broad distribution from 10 to >290 nm, whereas individual clutch length cycles through time (blue). Reduction of the number of motors shifts the length distribution to lower values, and the individual clutch length remains relatively constant (red). (C) A catch-slip bond model was fit to integrin catch bond data from Kong et al. (32). The fitted catch-slip bond model was incorporated into the motor-clutch model to produce qualitatively similar results to the simplified slip bond motor-clutch model. The catch-slip bond model produces a minimum in actin retrograde flow with respect to substrate stiffness, and this minimum can be shifted by coordinately changing the number of motors and clutches.