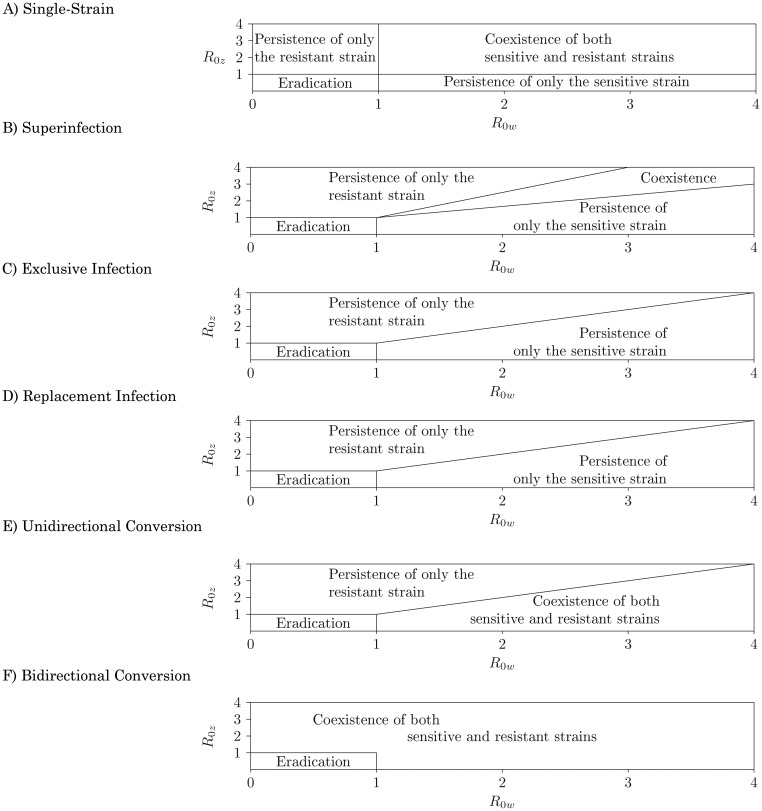
Figure 3.
Bifurcation diagrams of competition between antibiotic-sensitive (IW) and antibiotic-resistant (IZ) bacterial strains for 6 model structures. Each axis represents a strain-specific R0, calculated in the absence of the competing strain (see Web Appendix). Model structure alters the result of competition between sensitive and resistant strains across strain-specific transmission strengths.

