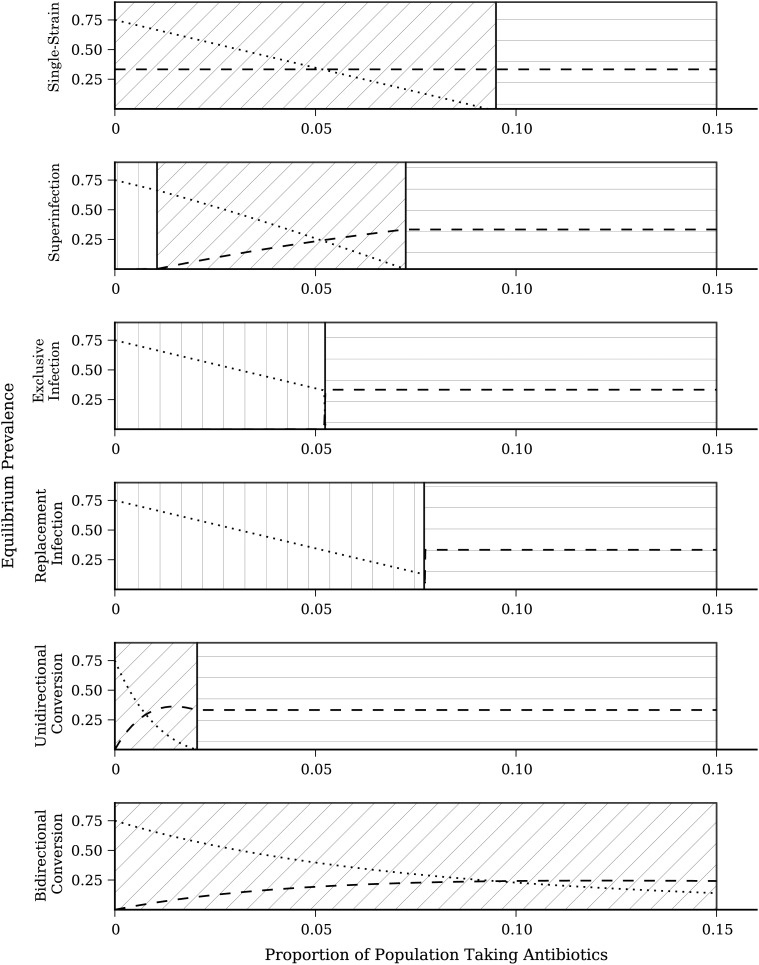
Figure 4.
Equilibrium prevalence of antibiotic-sensitive (IW) and antibiotic-resistant (IZ) bacterial strains for 6 model structures. Dashed lines represent the prevalence of antibiotic-sensitive strains; dotted lines represent the prevalence of antibiotic-resistant strains. Parameter values are held constant across model forms (Table 2). The background hatching denotes regions of antibiotic treatment parameter space. Vertical hatching indicates a region where only the antibiotic-sensitive strain persists; diagonal hatching indicates a region where both strains coexist; and horizontal hatching indicates a region where only the antibiotic-resistant strain persists.

