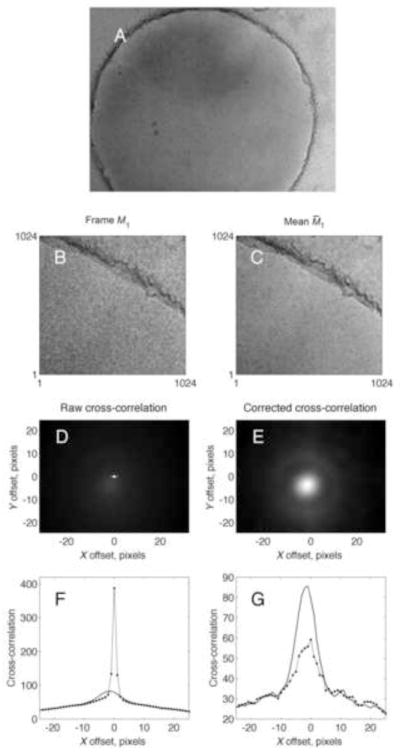
Figure 1.

DE-12 images and cross-correlations. A, the sum of 9 frames, each 4k × 3k pixels, corresponding to a total exposure of 18 e/A2. B, a 1k × 1k region of the first individual frame M11; C, the corresponding region of the mean of the other frames M̄21. D, unweighted cross-correlation between M11 and M̄21. Note the very bright pixel at zero offset which arises from pixel noise; it is 6 times larger than the true, diffuse peak at centered at the pixel location (−1.6, −3.8). E. The cross-correlation corrected by the subtraction of the estimated pixel-noise spectrum S̃P. Panels F and G show horizontal slices through the images D and E at a y offset of 0 and −4 pixels, respectively. Solid curves show the raw cross-correlation, and dots indicate the cross-correlation after subtraction of the pixel-noise component. The image is of a cryo-EM specimen of 400 kDa protein particles on a C-Flat grid having 1μm holes, with thin carbon overlaid. Imaging was at 200 keV with 2.0 μm defocus. The image had an effective pixel size of 2.9Å.
