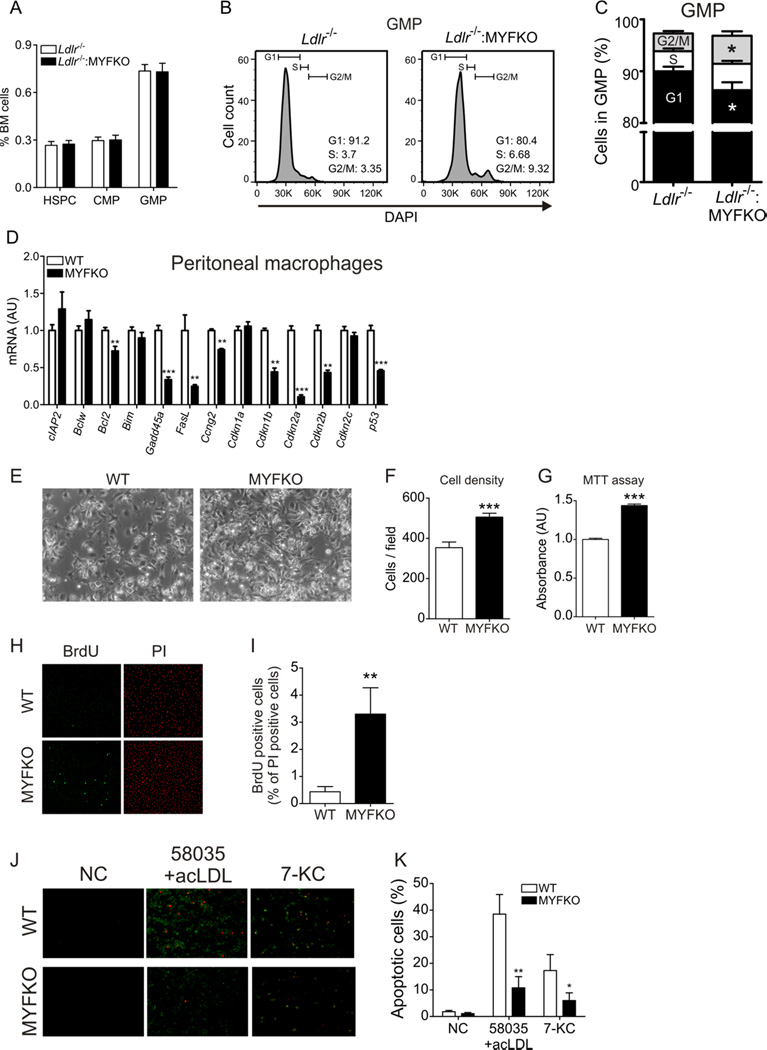
Figure 2. Proliferation and apoptosis of BM and macrophages.
(A) Percentage of hematopoietic stem and progenitor cells (HSPC), common myeloid progenitors (CMP), and granulocyte-myeloid progenitors (GMP) in BM (n=5). (B) Representative scatter plots and (C) quantification of cell cycle progression in HSPC, CMP, and GMP using DAPI staining (n=5). (D) Expression of apoptosis- and cell cycle-related genes in cultured peritoneal macrophages (n=5–6). (E) Representative pictures and quantification of cell densities assessed by (F) counting and (G) MTT assay of peritoneal macrophages after 32 h of culture (n=4). (H) Representative pictures of BrdU and propidium iodide (PI) staining and (I) percentage of BrdU-positive cells of peritoneal macrophages after 32 h of culture (n=4). (J) Representative pictures and (K) quantification of Annexin V (green) and PI staining (red) in macrophages loaded with free-cholesterol (58035 10µg/ml + acLDL 100µg/ml) or 7-ketocholesterol (10µM) for 20 h. * p < 0.05, ** p < 0.01, *** p < 0.001 vs. WT or Ldlr−/−.

